Instant Visibility See Everything in Your Zscaler Configuration
into Every Policy Relationship
Scroll Down
Transform your Zscaler admin console with intelligent visual enhancements that reveal hidden dependencies, usage patterns, and configuration insights—all without leaving your familiar interface.
90% reduction in investigation time - from 15 minutes to
Immediate Visibility
From Complexity to Clarity
ZHERO overlays powerful visualization capabilities onto your existing Zscaler interface, transforming complex relationships into intuitive, actionable insights without disrupting your workflow.
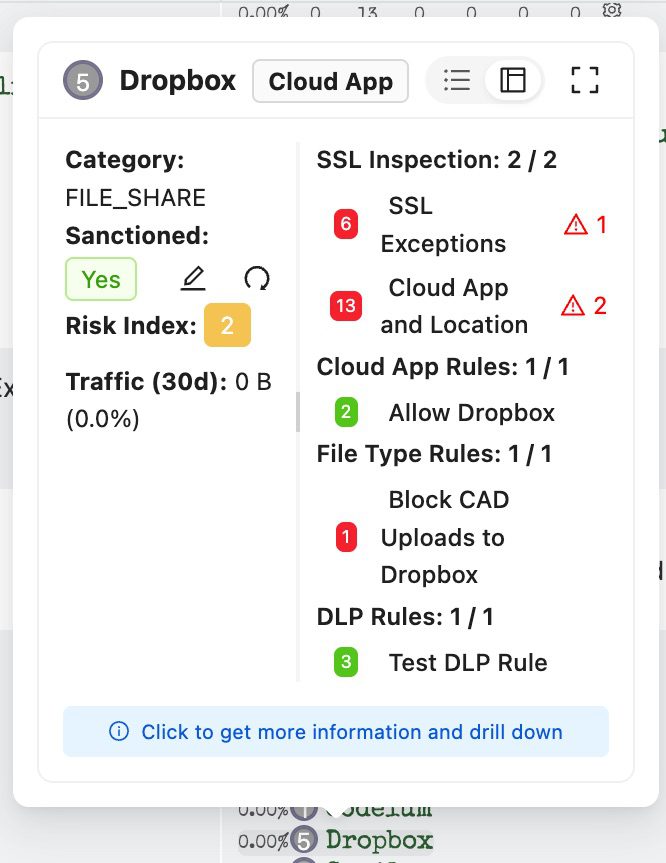
Comprehensive Usage Analytics
Track how each entity is used throughout your Zscaler policies with precise counters and interactive visualizations. Identify orphaned configurations, redundancies, and optimization opportunities with ease.
Want to know more?
In Zscaler’s powerful but complex interface, understanding entity relationships is like solving a puzzle blindfolded
Three Layers of Progressive Insight

Find Anything Anywhere
Universal search for
No more navigating through menus. Press CMD/CTRL + K to:
- Search all policies across your tenant
- Find specific entities or configurations
- Access from any page, even logs
Unreachable Policy Detection
ZHERO automatically identifies policies that will never trigger due to precedence rules — across 18 entity types including firewall, URL filtering, SSL inspection, and ZPA access policies
- Visual gray-out of unreachable policies

Traffic Analytics Integration
See the last 30 days of traffic for:
- URL Categories: Which ones are actually being hit?
- Locations: How much traffic per location?
- Firewall Rules: was a rule hit in the last 30 days?
- Applications: Usage patterns and trends
- All data available with one click
Audit Log Visualization
Integrated last 30 day audit trail for every entity showing:
- Who made changes
- When modifications occurred
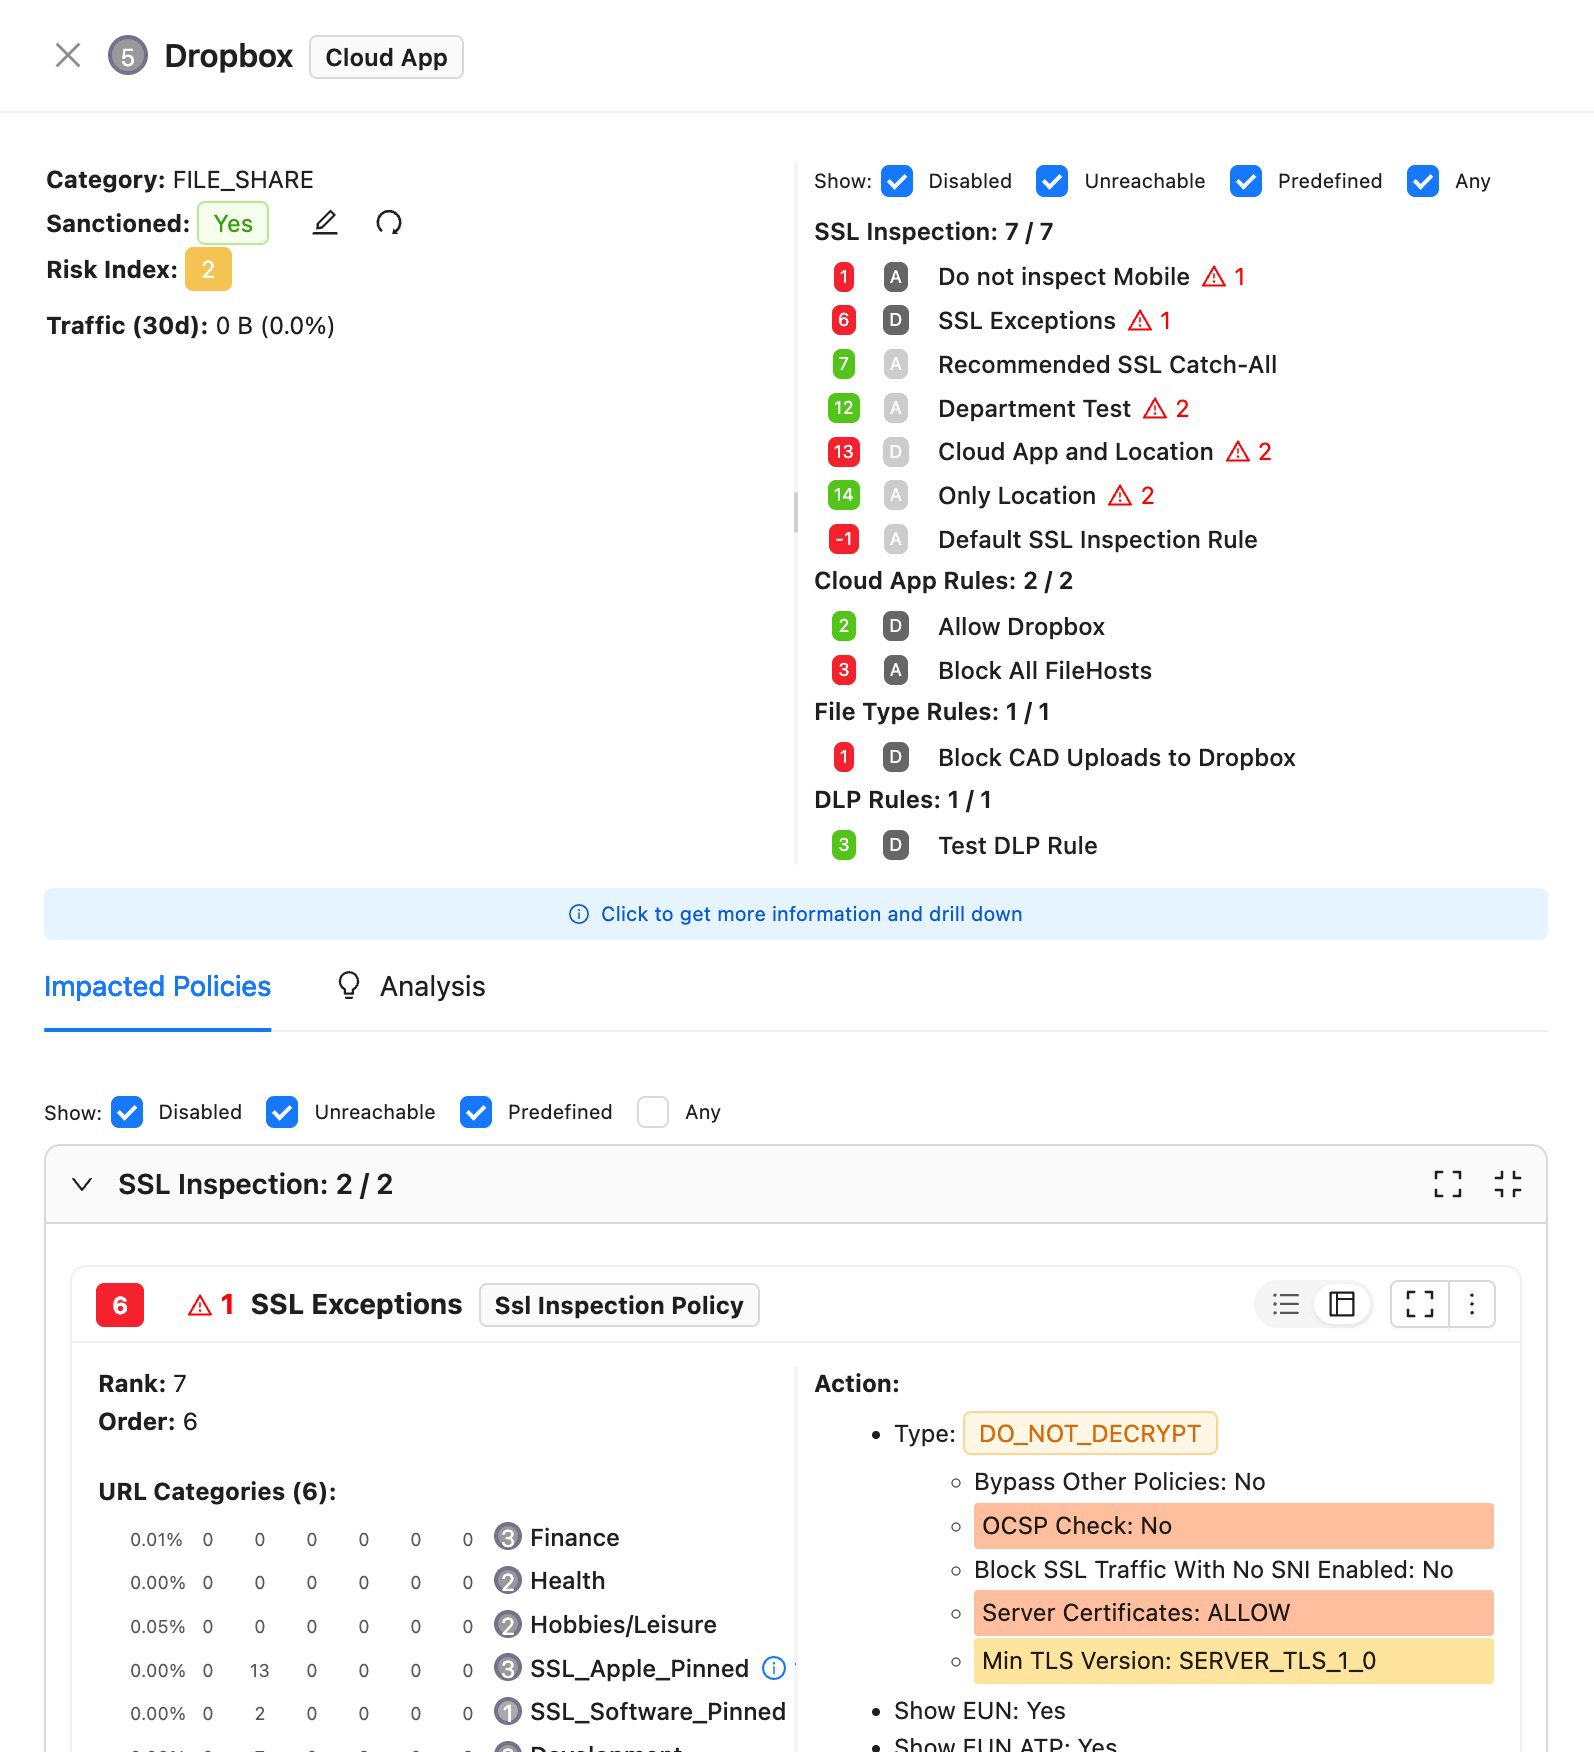
Analysis Indicators
Visual cues alert you to issues:
- Critical security gaps
- Optimization opportunities
- Best practice suggestions
- Each linked to detailed explanations
Real-Time Configuration Safety Net
ZHERO catches misconfigurations before you apply them.
- Pre-activation what-if analysis across 18 entity types
- Warning counters update in real-time as you configure
- See the impact of your changes before they go live
- Works invisibly — no extra steps in your workflow
Multi-Platform Visibility
ZHERO enhances not just ZIA, but also ZPA and Experience Center:
- ZPA Access Policies with visual condition display
- Application Segments and Criteria Entities
- Client Forwarding Policies
- Consistent experience across all Zscaler platforms
Enhanced URL Management
Complete URL Intelligence
- Preemptive Categorization with batch URL Lookups
- Cross-Reference Links: Navigate between specific and wildcard versions
- Unified URL View: See URLs across categories, groups, exemptions, PAC files
- Bulk Operations: Select, move, delete, export URLs efficiently
- URL Source Tracking: Visual indicators show ZIA (blue), ZPA (green), or both platforms
Shared URL Intelligence Cache
The first admin to look up a URL benefits every admin after them.
- 95% reduction in API calls with shared categorization cache
- Privacy-preserving: only categorized public URLs are shared, no reference to the tenant.
- Three-tier freshness model ensures accurate data
- Opt-in for team environments
Watch a 4-minute demo:
Ready to Transform Your Zscaler Experience?
Talk to Our Team!
