Investigation & Diagnostics Answer "What Happened?" Across ZIA and ZPA
In Under 5 Minutes
Scroll Down
When something goes wrong — a user can’t access a site on ZIA, or an application isn’t reachable on ZPA — the admin enters a maze of policy types, diagnostic logs, and configuration layers. The native consoles show data, but not answers.
ZHERO changes this with two purpose-built investigation engines — one for ZIA, one for ZPA — that turn hours of manual cross-referencing into minutes of guided analysis.
The Investigation Tax

Two Engines, One Mission
Different platforms, different data sources — same goal: give you answers fast.
ZIA Troubleshooting Engine
- Visual traffic flow with interactive Sankey diagram
- 11 policy layers evaluated simultaneously
- HAR file analysis correlated with Zscaler policies
- ZIA Insights — query real traffic logs for any user
ZPA Diagnostics Engine
- Multi-dimensional drilldown — users, domains, domain:port
- One-click Excel export of any drilldown result
- Raw logs with infinite scroll and search history
- Background operation — get notified when results are ready
Want to know more?
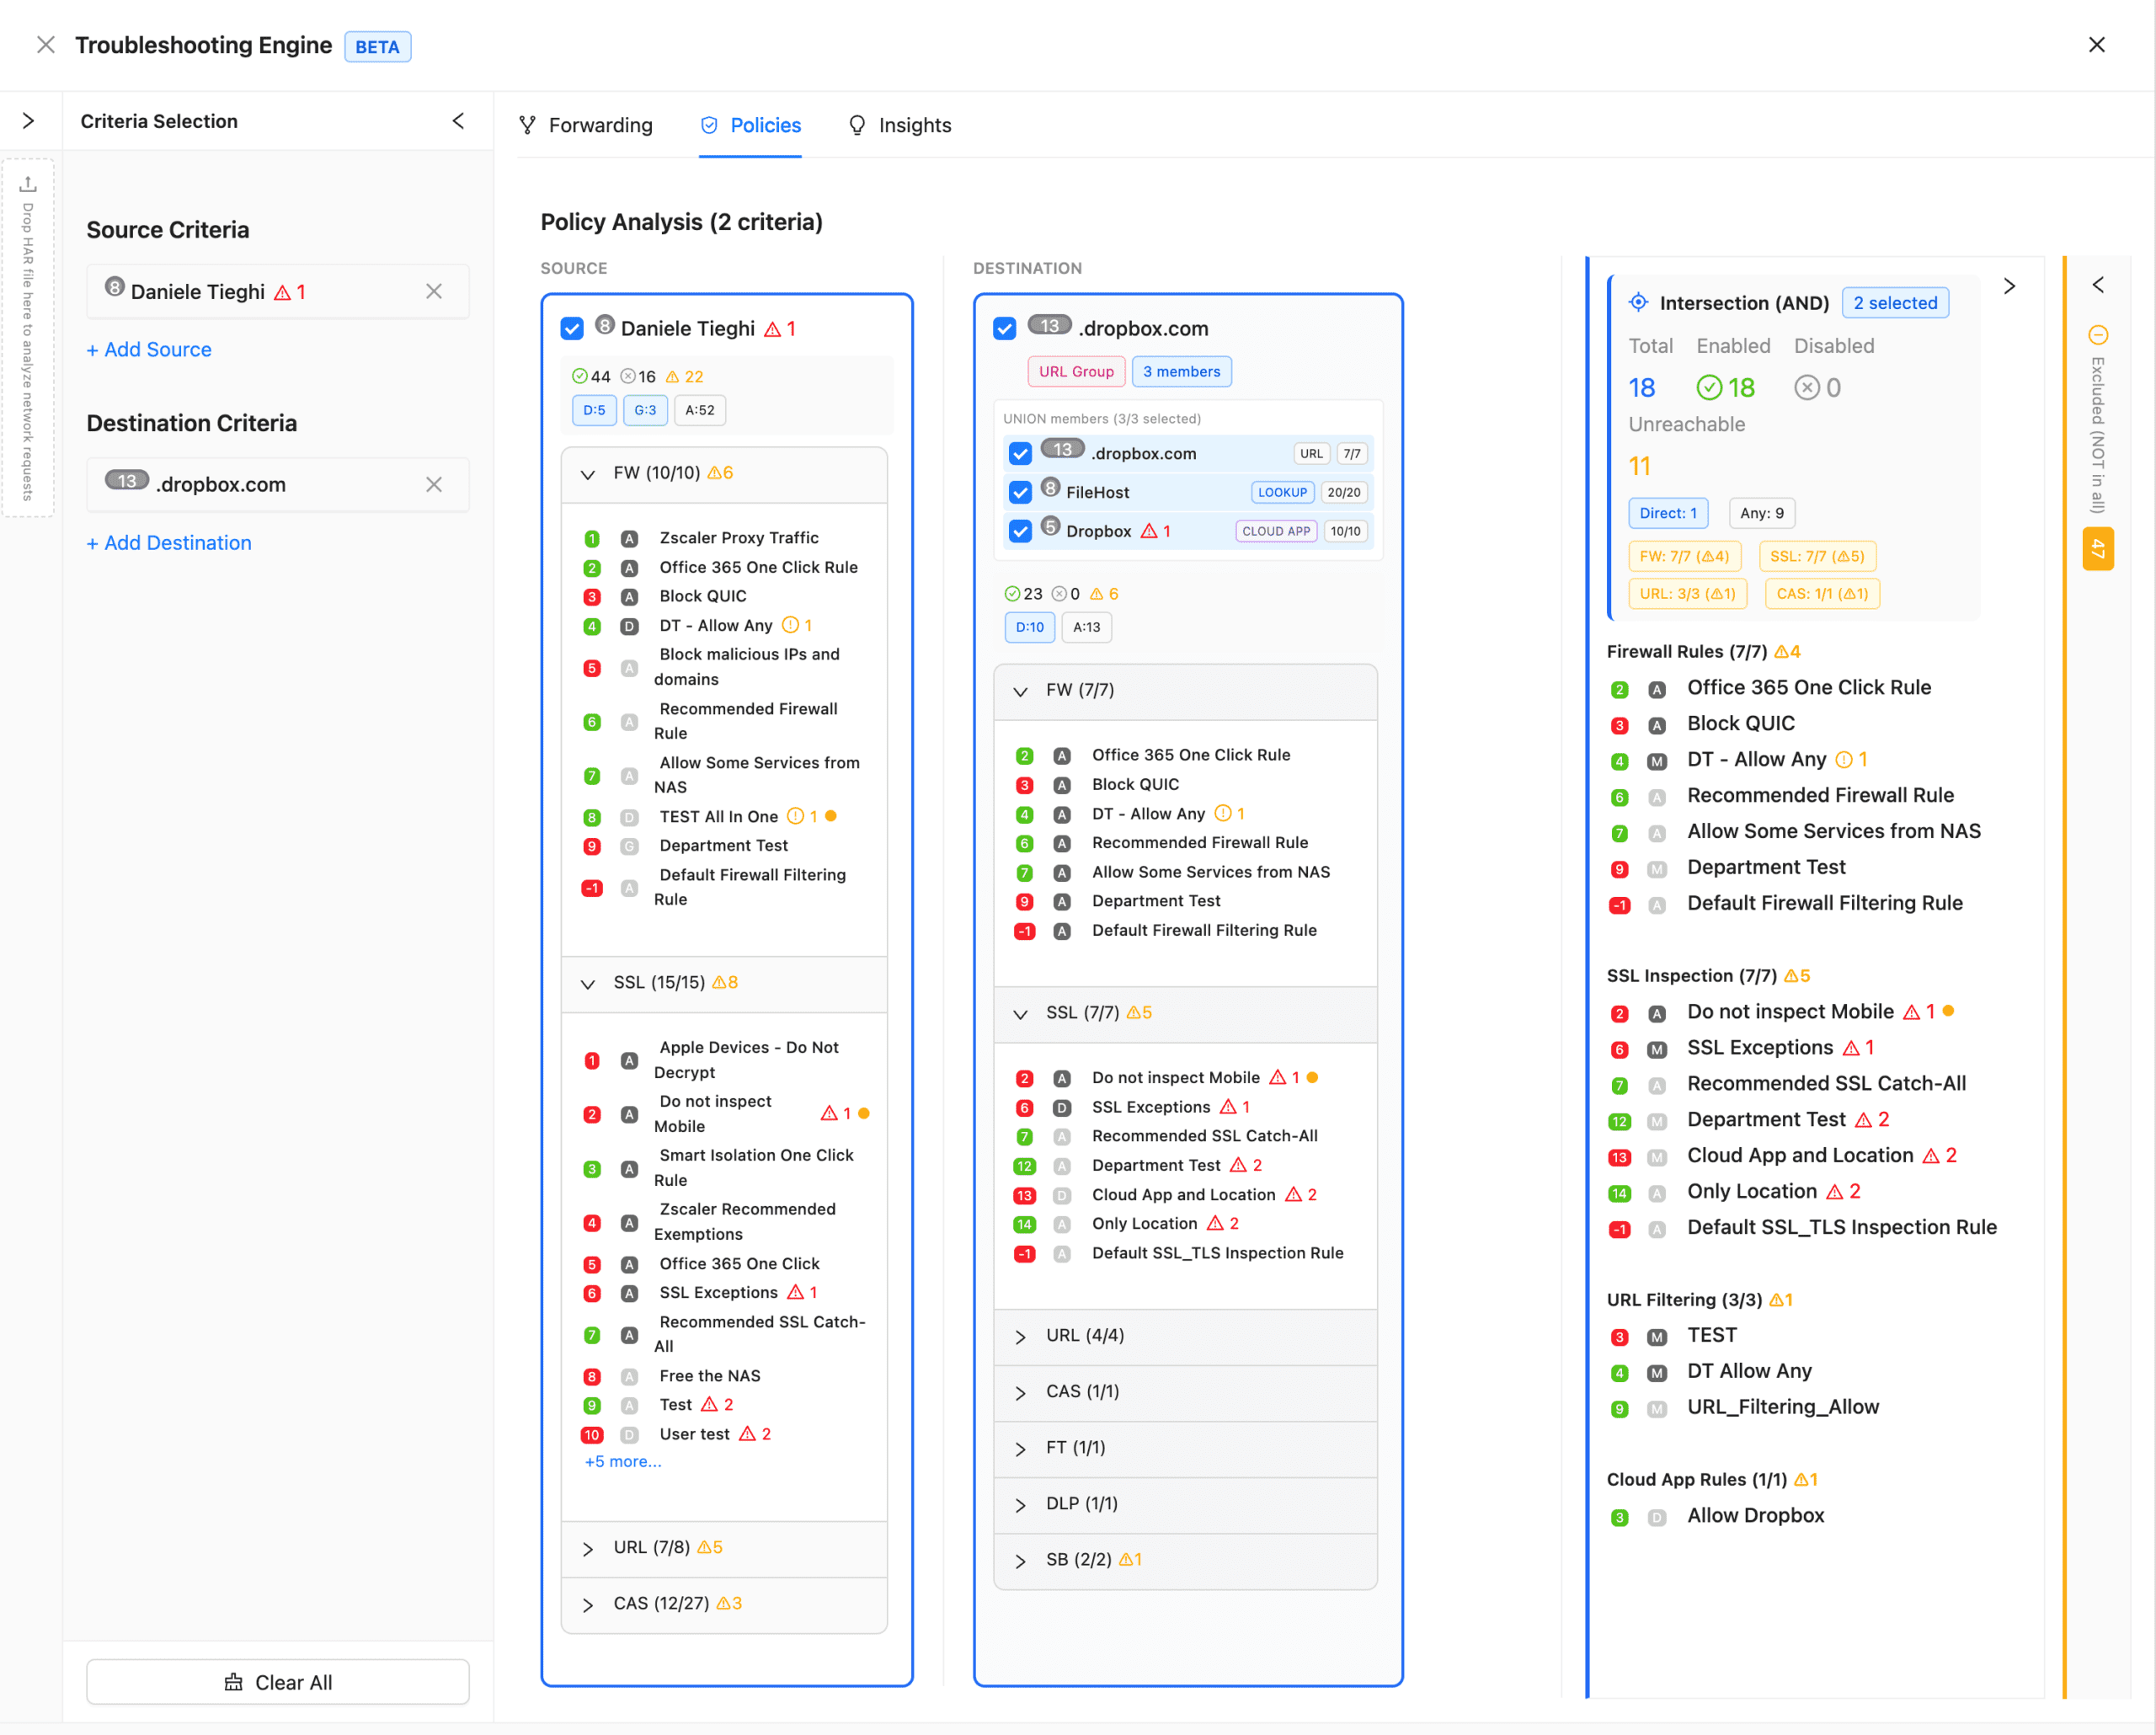
ZIA Troubleshooting Engine
Diagnose access issues end-to-end with visual traffic flow, multi-layer policy analysis, and real traffic correlation.
Traffic Flow Visualization
- Interactive Sankey diagram
- Auto-updates on criteria change
- Entity cards on hover
- Proportional flow scaling
- Click to drill into any entity
Multi-Layer Policy Analysis
- 11 policy types simultaneously
- Clear ALLOW/BLOCK indicators
- Rule priority and precedence
- URL expansion testing
- Complete evaluation chain
HAR File Analysis
- Drag & drop upload
- Domain extraction
- Policy correlation
- Error identification
- Request analysis
ZIA Insights Integration
- Real traffic data from ZIA logs
- User-specific transaction analysis
- Time-based queries
- Policy hit tracking
- Blocked request details
Session Management
- Save complete investigation sessions
- Session history for quick access
- Continue investigations later
- Local storage via IndexedDB
Privacy-Preserving Architecture
- 100% browser-based analysis
- HAR files never leave your machine
- Uses existing Zscaler API session
- No data transmitted to ZHERO servers
Multi-Criteria Scenarios
- Specific user + location + URL
- Device group + application + time range
- Any combination of criteria
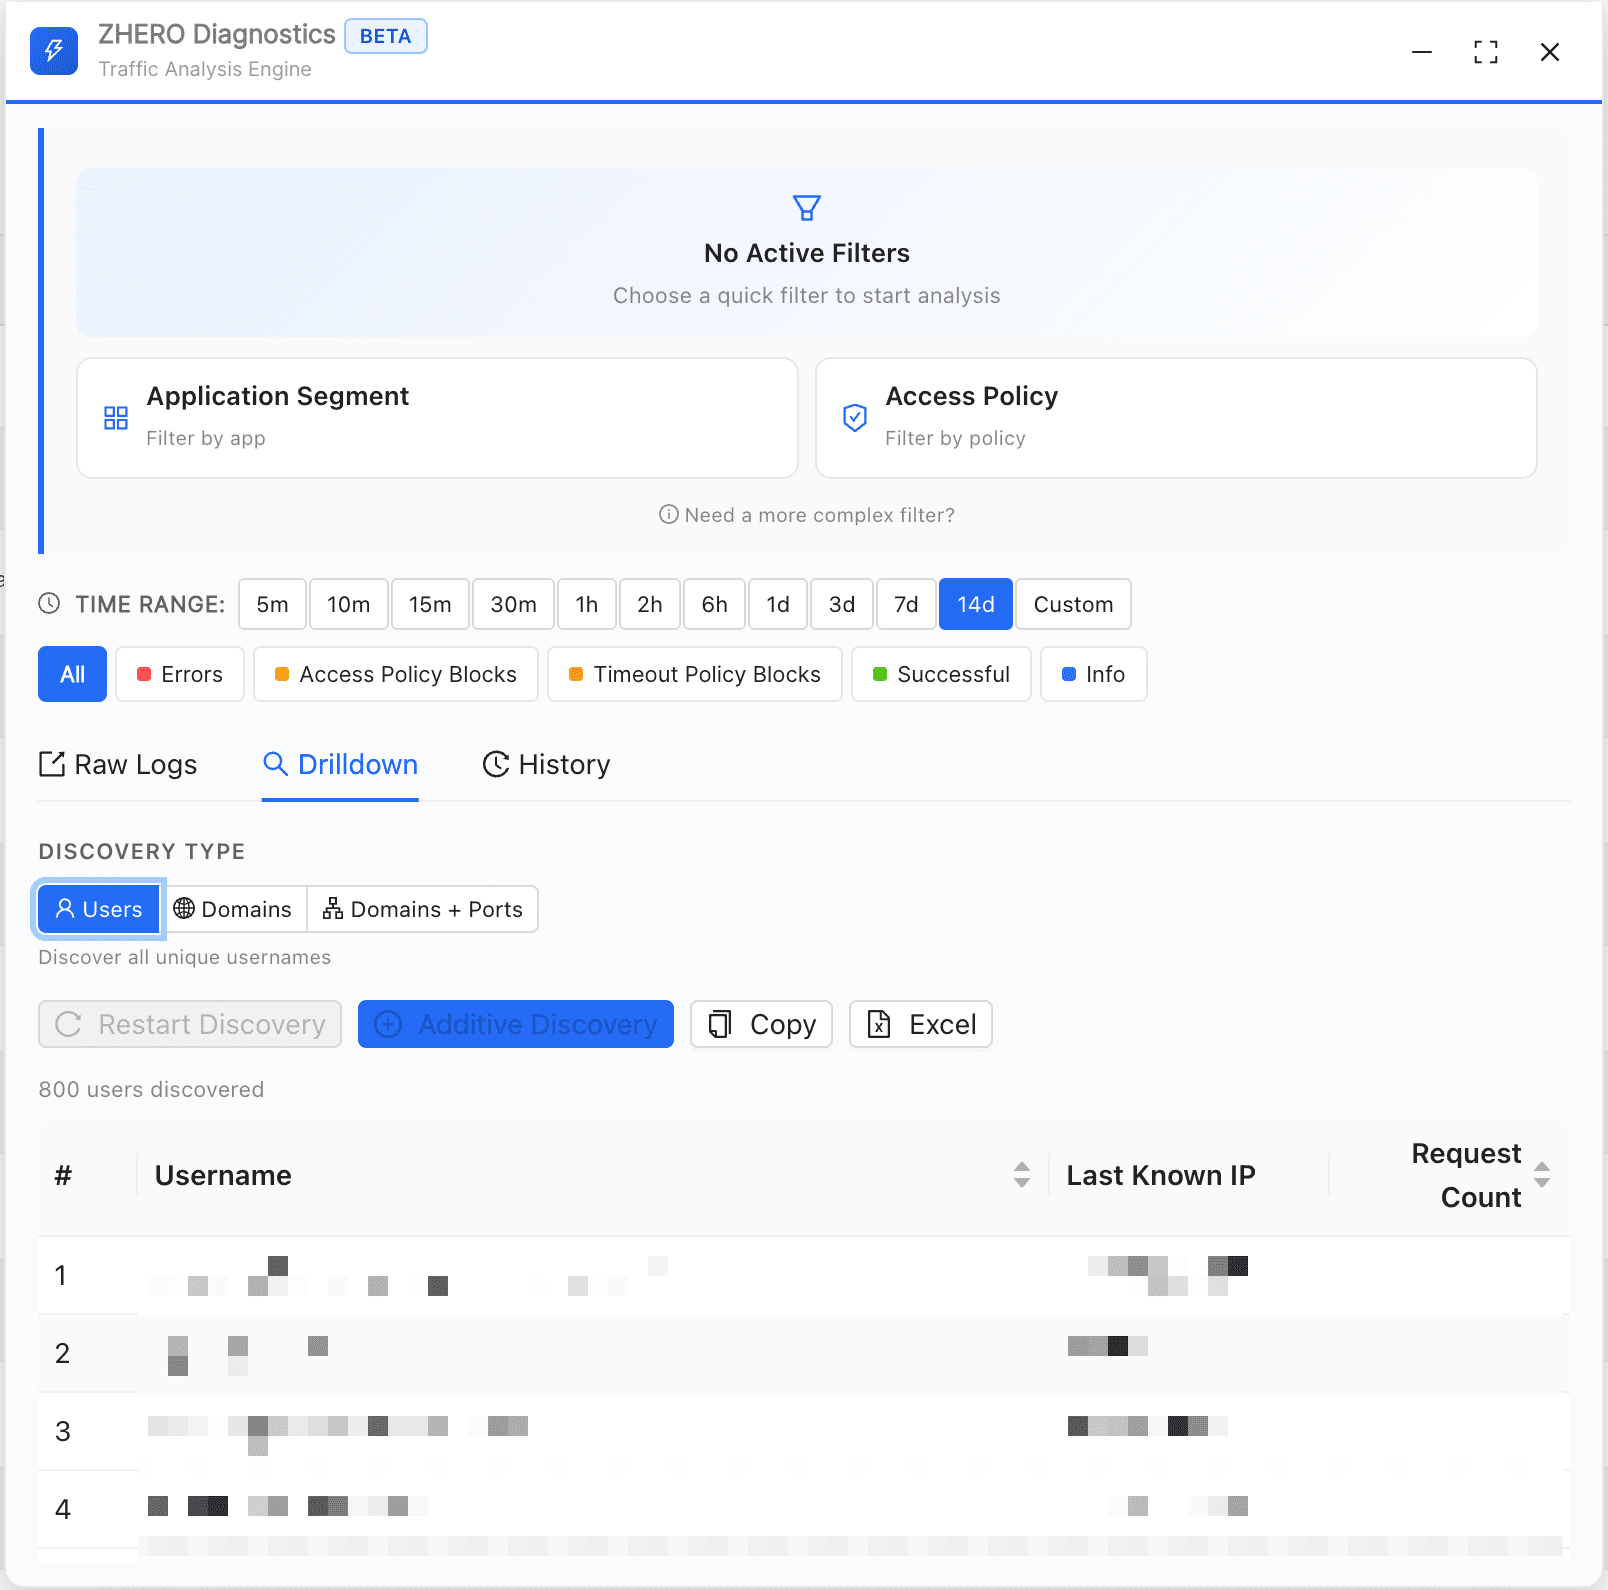
ZPA Diagnostics Engine BETA
Turn raw ZPA diagnostic data into actionable intelligence — without leaving the console.
1. Launch Panel
2. Set Filters & Search
Use the native ZPA filters — ZHERO reads them automatically and runs in the background
3. Drill Down & Export
Multi-Dimensional Drilldown
Extract all users, all domains, or full domain:port combinations from any diagnostic search result.
Floating Panel
Draggable, resizable panel that works alongside the native ZPA Diagnostics page — never leaves your workflow.
Raw Logs
Search History
Excel Export
Entity Enrichment
Watch a 4-minute demo:
Talk to Our Team!
