Investigation & Diagnostics Answer "what happened?" in under 5 minutes.
When a user says "I can't access this site", the native consoles show data, not answers. ZHERO answers the question directly: will this traffic get through ZIA and ZPA, and if not, which rule stops it. Then it reads the logs that prove it.
75% reduction in Mean Time To Resolution with multi-layer visibility.
One engine for ZIA and ZPA, from verdict to proof
Investigation & Diagnostics removes the investigation tax: when something goes wrong on ZIA or ZPA, the admin normally enters a maze of policy types, diagnostic logs and configuration layers. ZHERO replaces that maze with a guided workflow that goes from a straight answer to the logs that prove it, in minutes.
Reachability verdict
Can this user reach this destination? A straight answer.
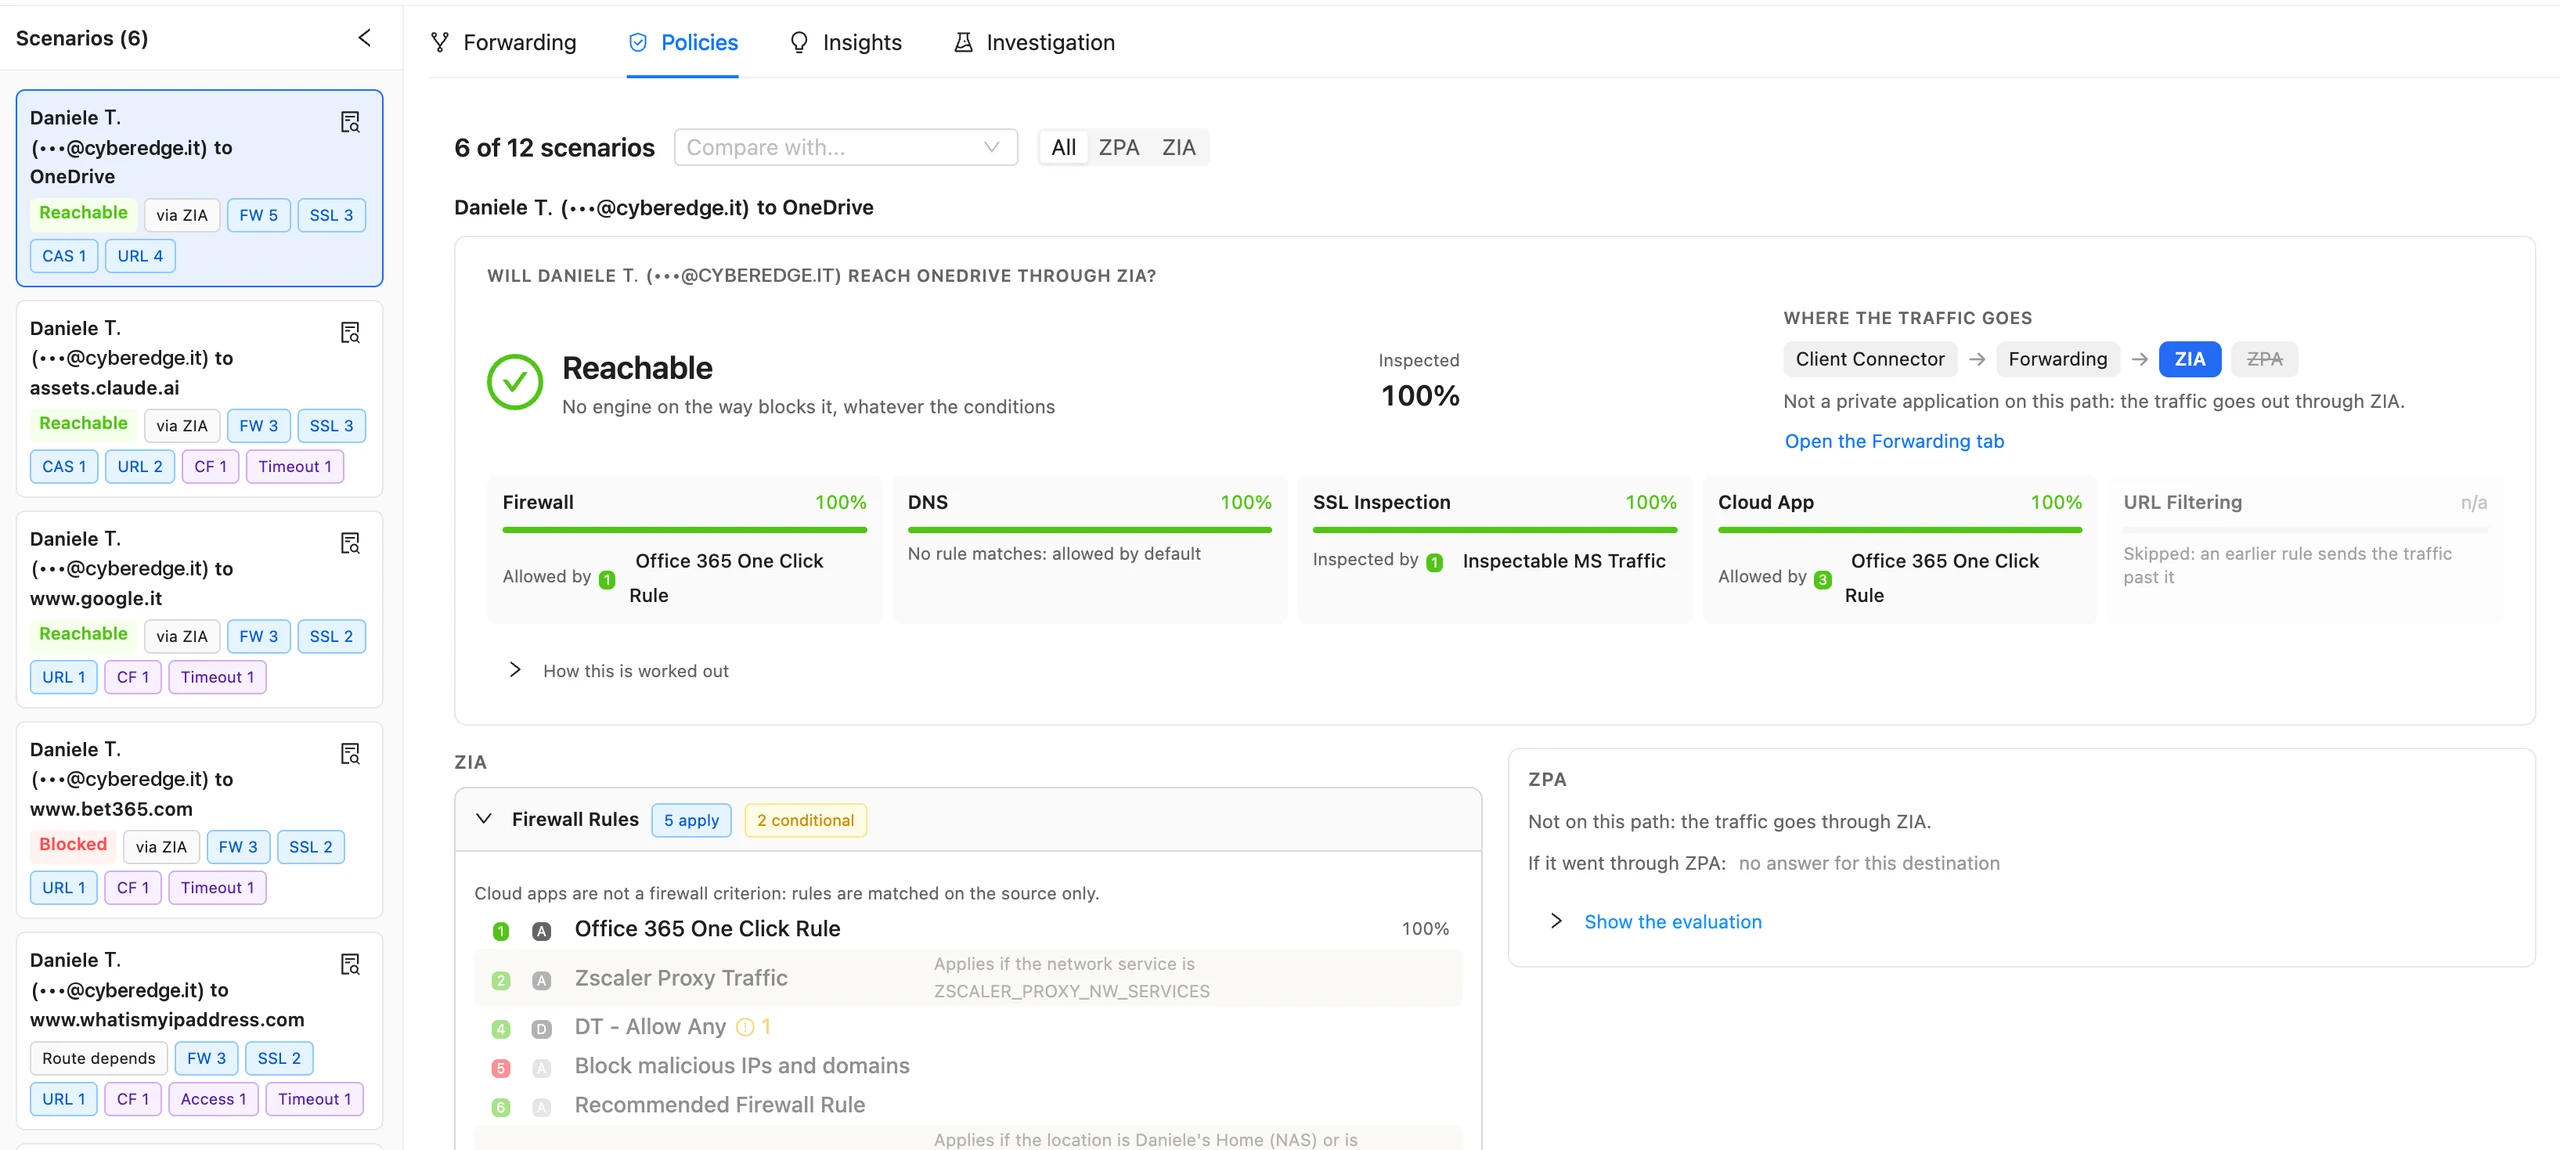
Describe the ticket as a scenario (who, from where, to what) and ZHERO says whether the traffic is Reachable or Blocked, naming the engine and the rule that stop it. It follows the traffic through each engine in real rule order, first match wins, for ZIA and ZPA side by side. When the answer depends on a platform, a location or a device group, ZHERO gives an estimate (Probably reachable, It depends, Probably blocked) and shows exactly which evidence it used: on ZIA, the user's own logs or your ZCC fleet. Above the engines, Where the traffic goes shows whether client forwarding sends it to ZIA or to ZPA.
- Up to 12 scenarios analysed at once, each with its own verdict
- ZIA and ZPA in the same view, with switched-off rules shown, not skipped
- Predicted against observed: the verdict is compared with what the logs show
Traffic flow
See where the traffic really goes
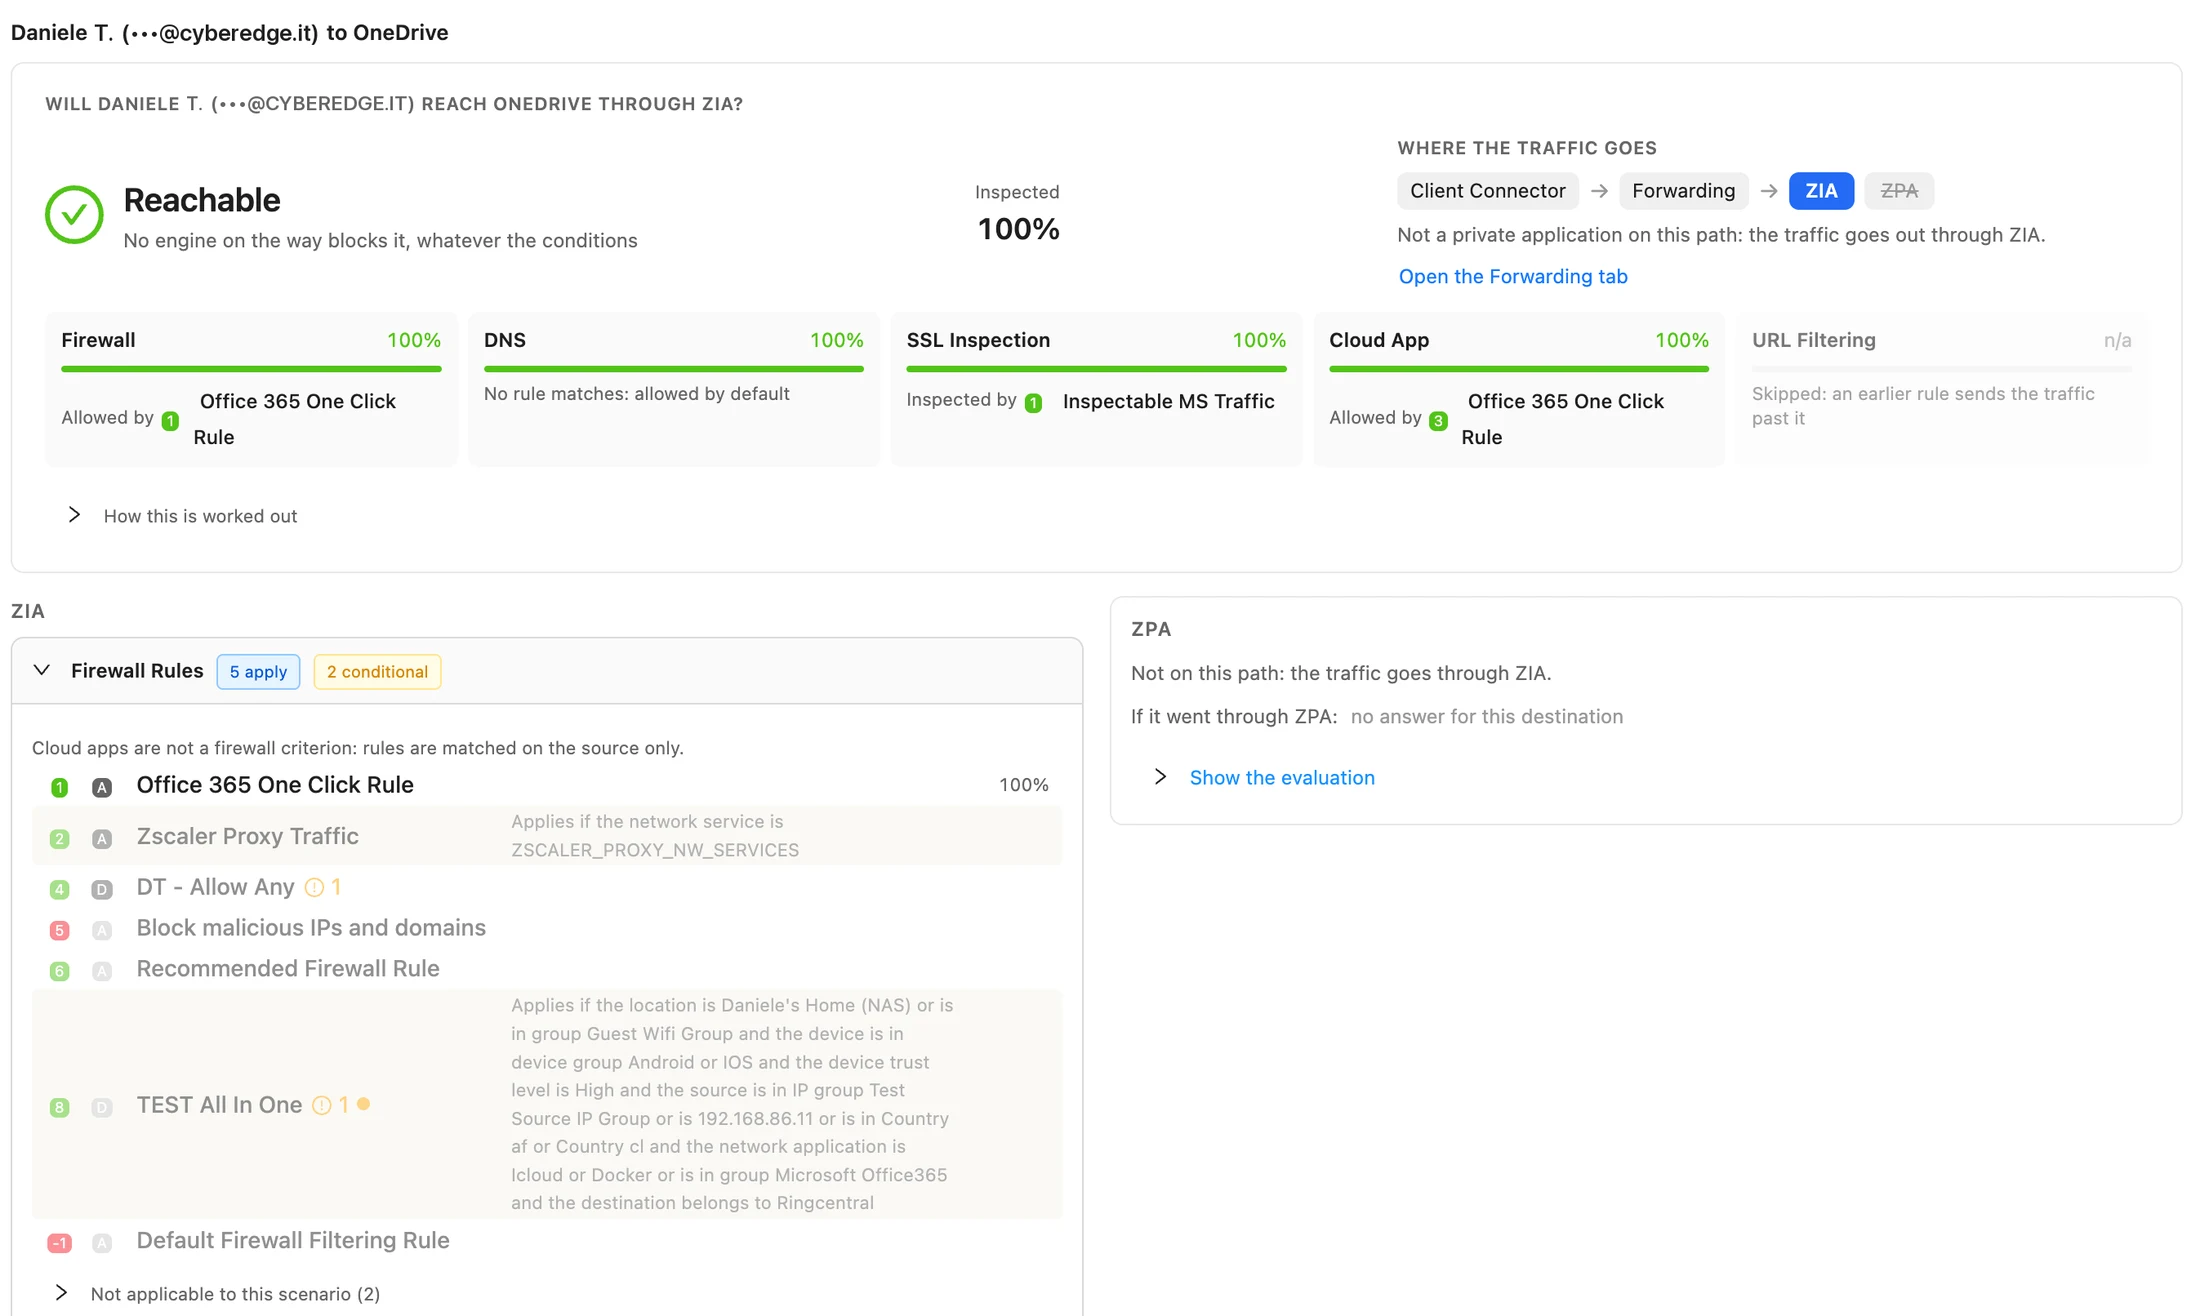
The Forwarding tab draws as an interactive Sankey diagram how your configuration routes the traffic: from device groups through forwarding profiles, network state (trusted, off trusted, VPN) and app profiles to ZIA or DIRECT, with the totals above it. Where the forwarding profile sends private apps to ZPA, that branch leaves straight from the network state. It is drawn only from what ZHERO actually read, never guessed; the rules that decide stay in the verdict. Filter it on a user's devices and a misassigned forwarding profile shows up as a path going somewhere you did not expect.
Log investigation
From "it failed at about 10:40" to the cause
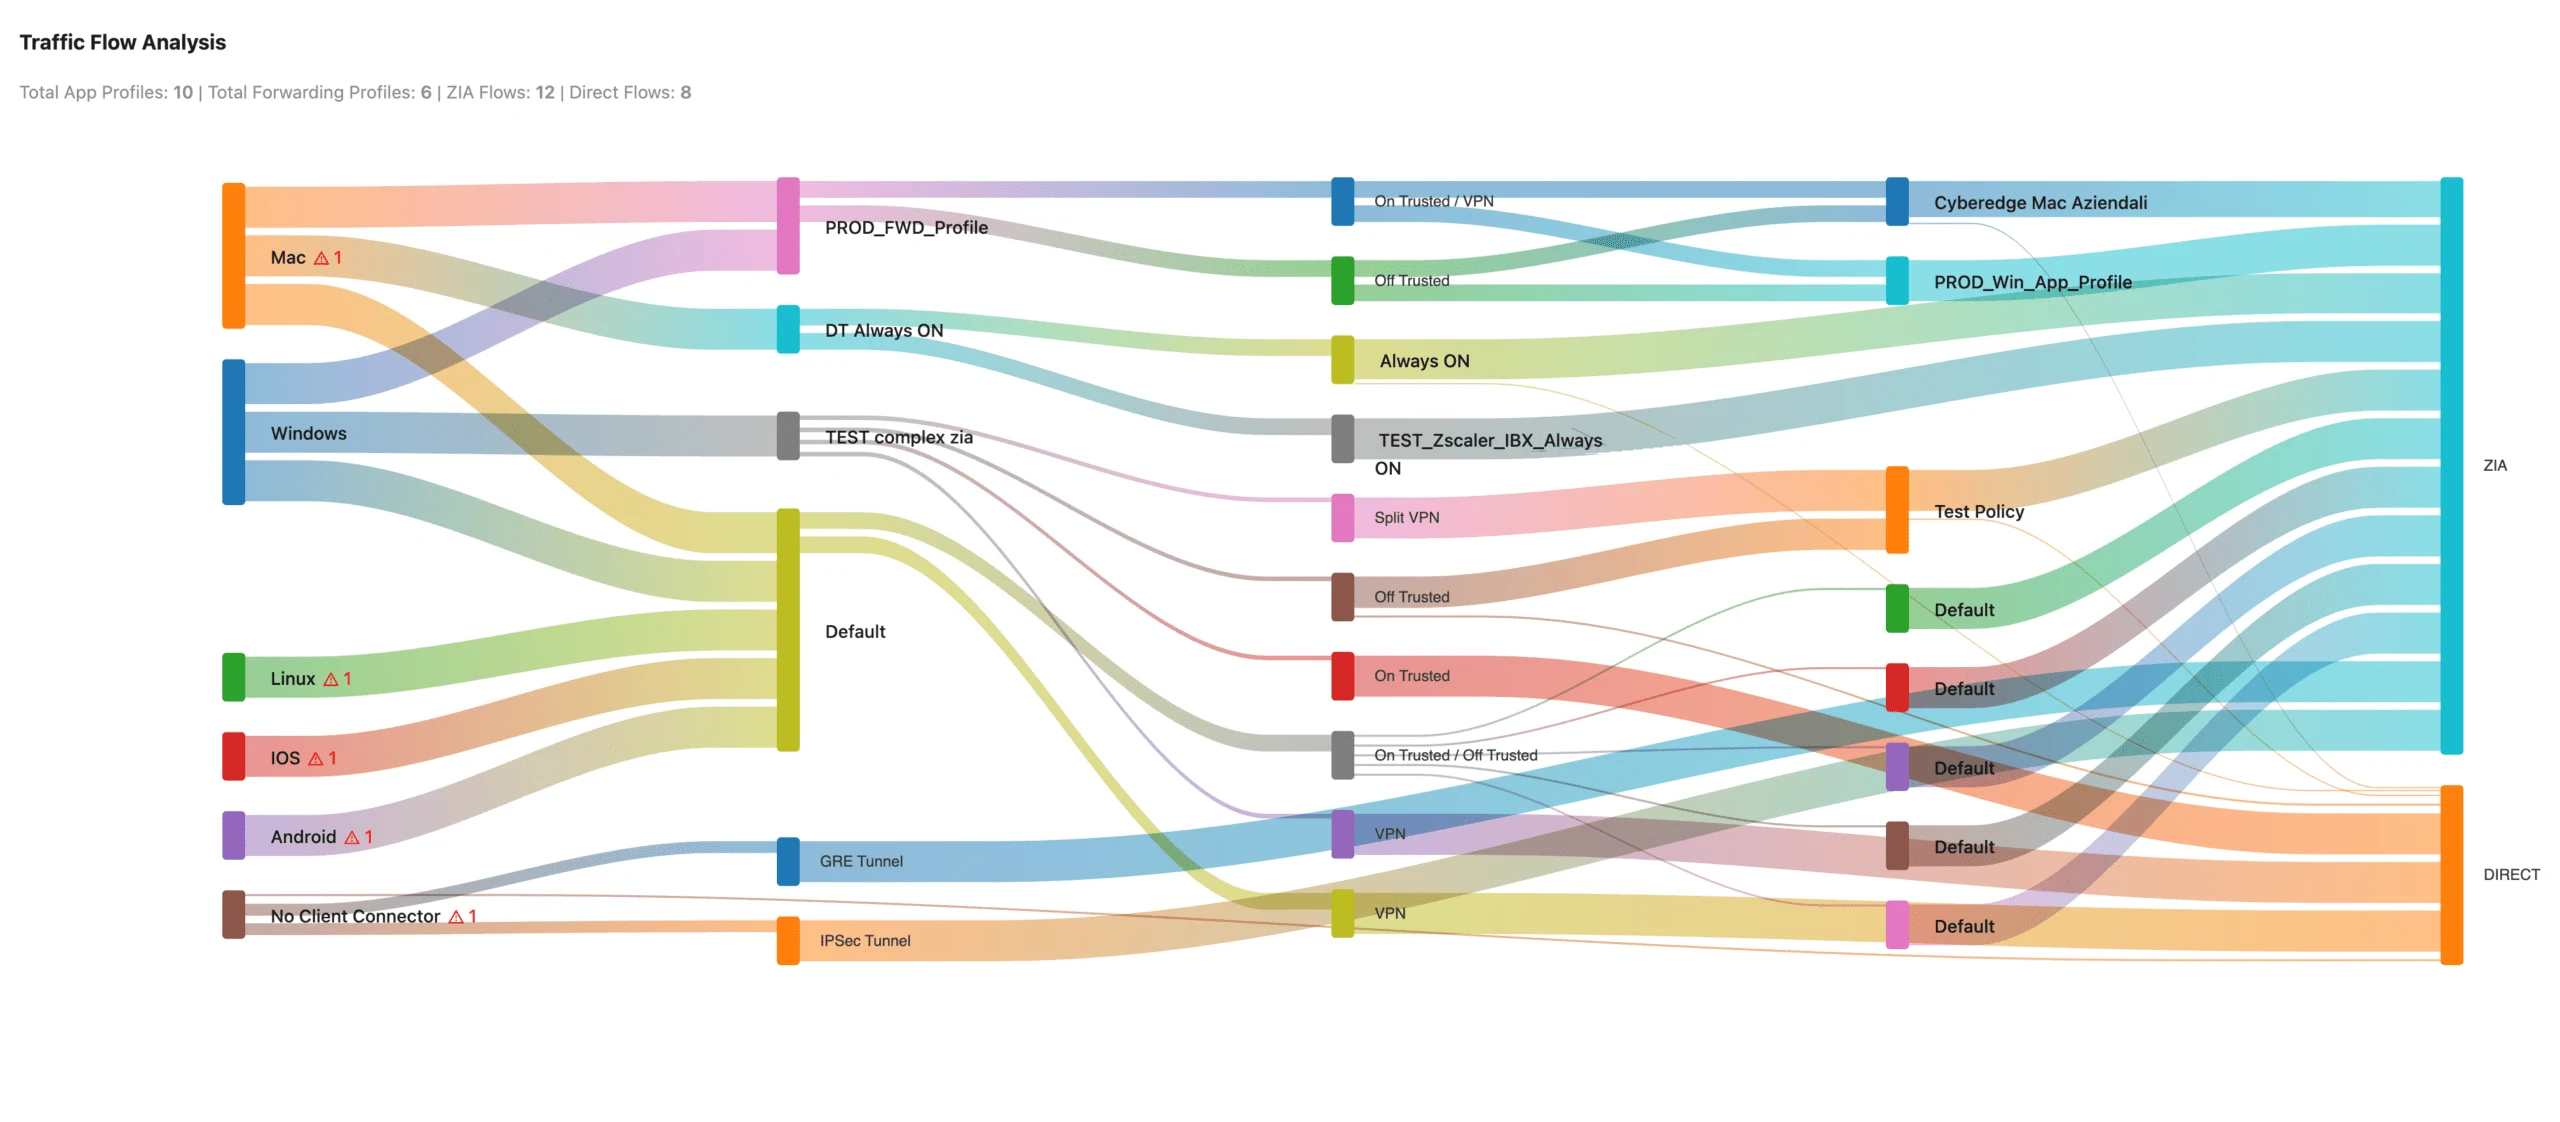
For a ticket with a time on it, ZHERO runs the relevant log reads one after another (the user's traffic, sub-resources, firewall, ZPA sessions, other users on the same target) and builds one timeline with diagnosis cards that name the likely cause and the next step. The target can be a host or a whole cloud app. When the ticket gives only a day, Only the day draws a heatmap of that day and points to where to look first.
Floating Logs panel
The logs of any entity, over the console
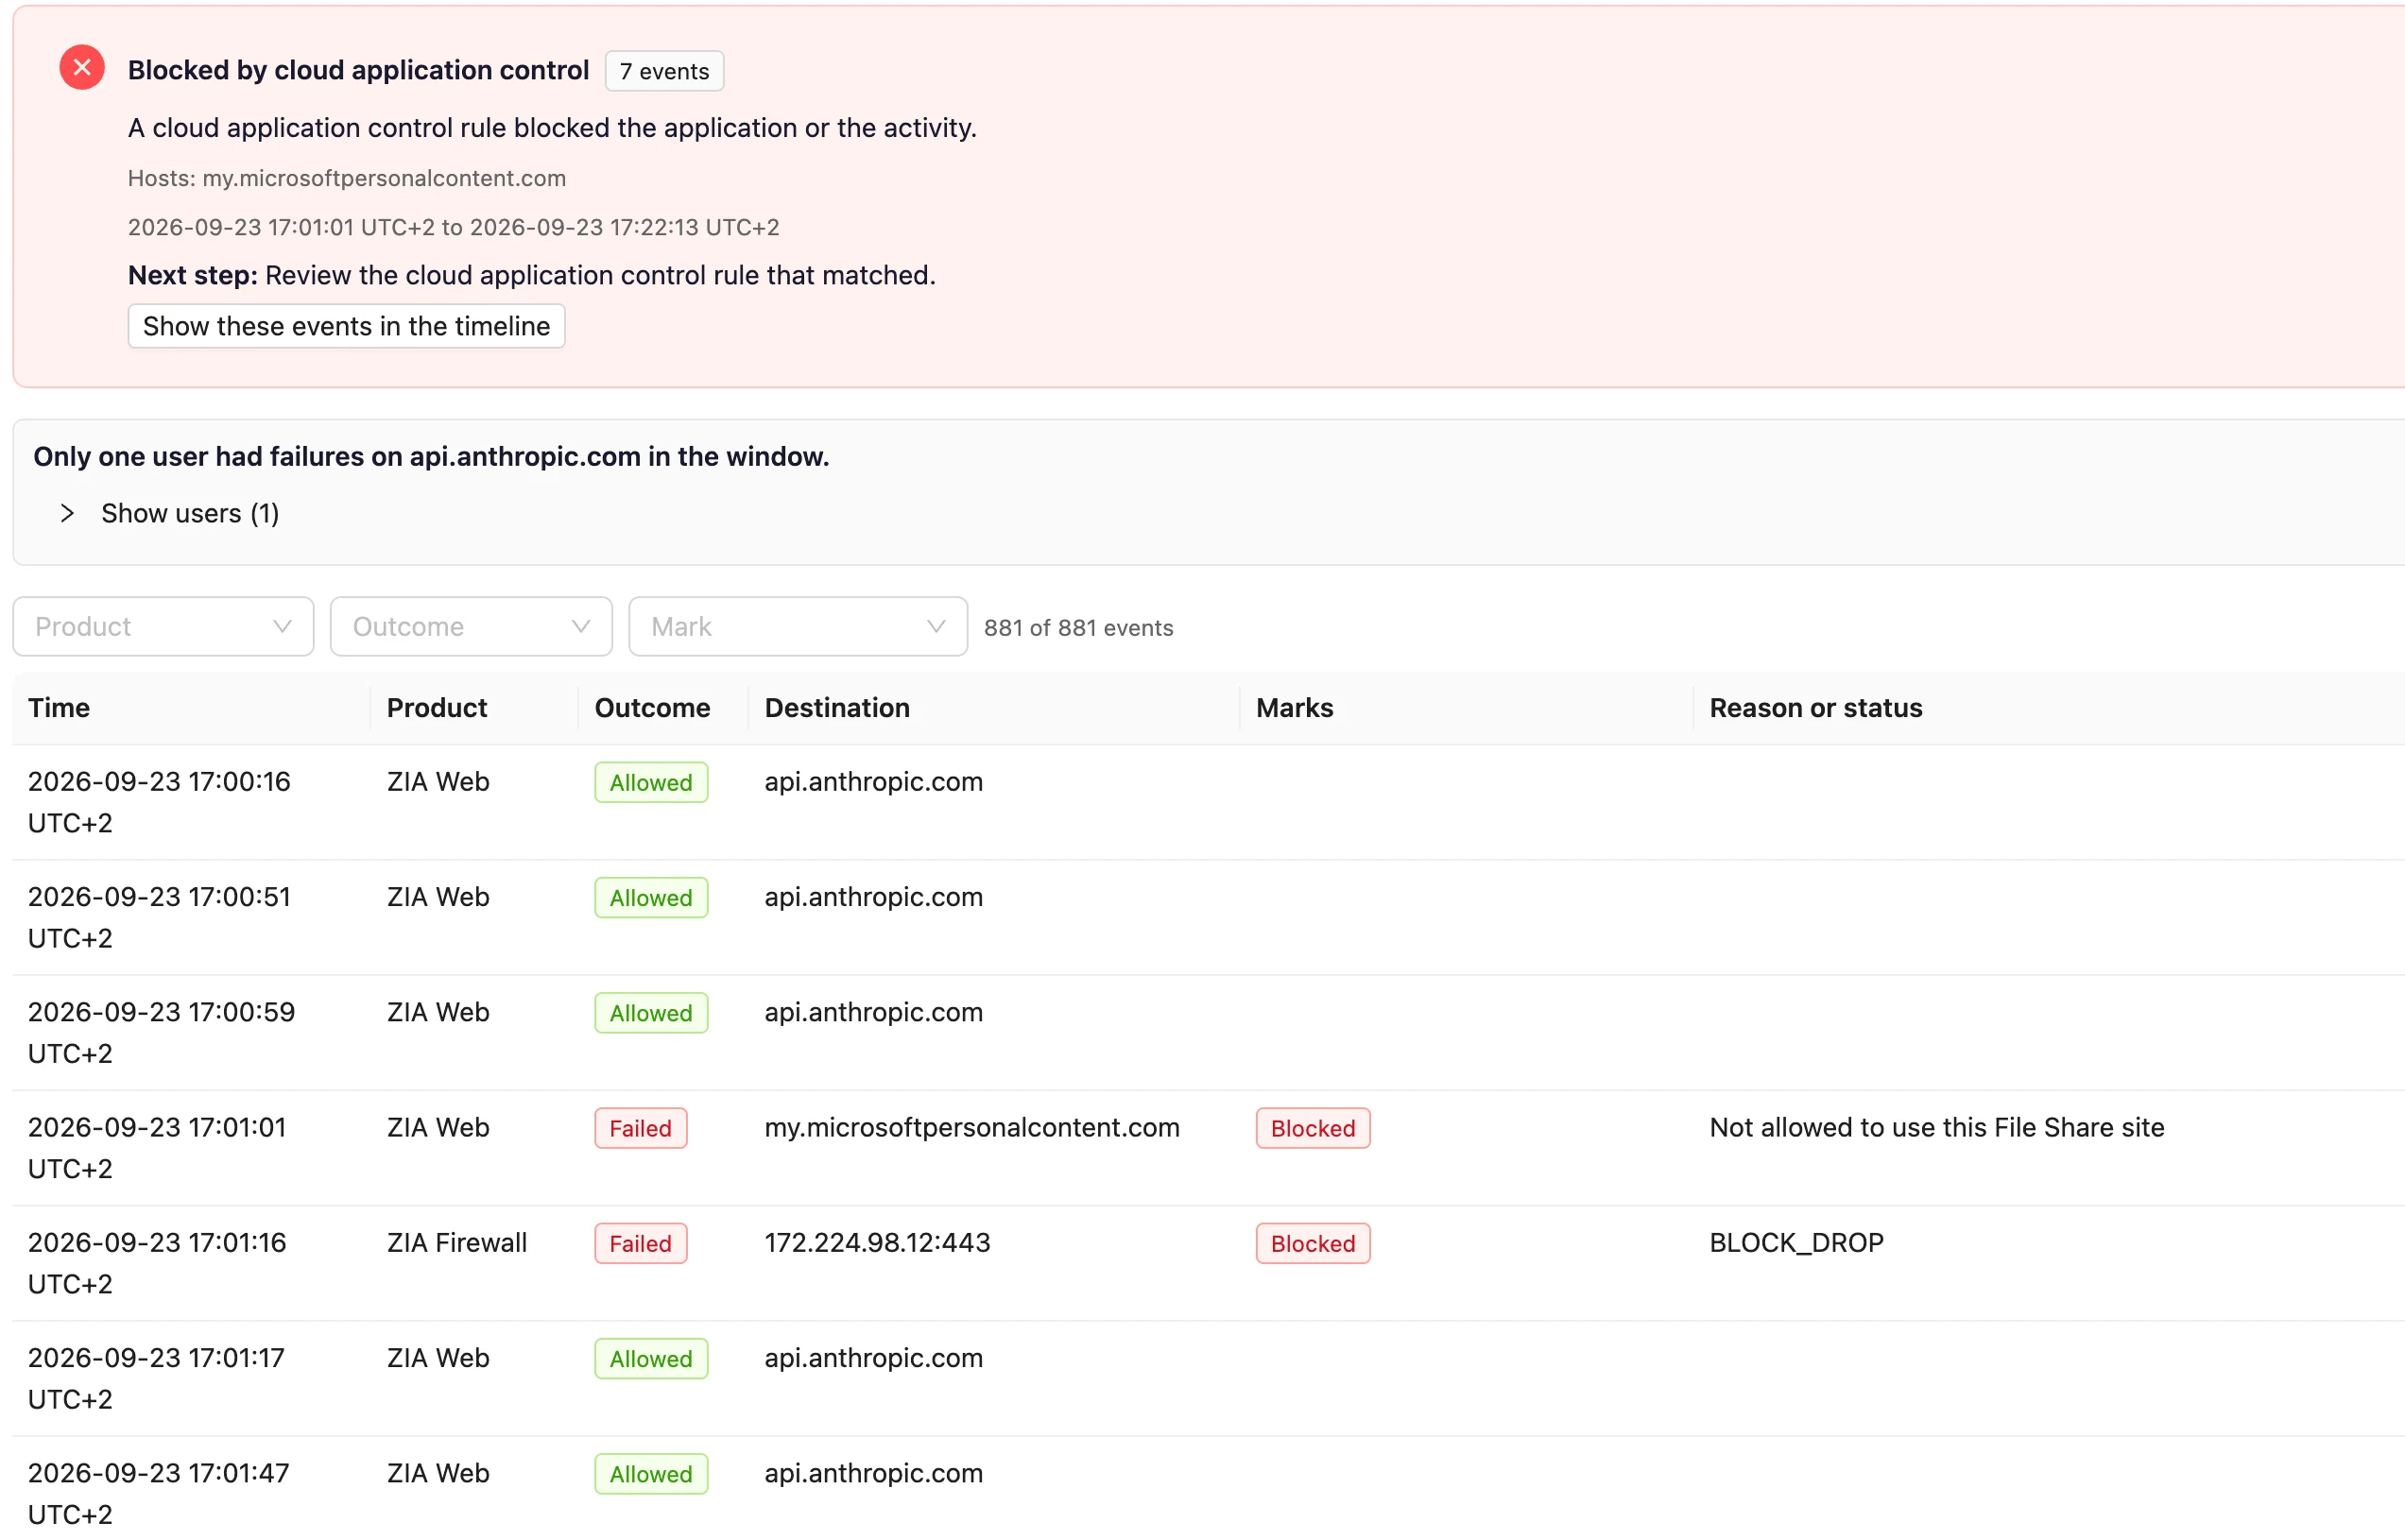
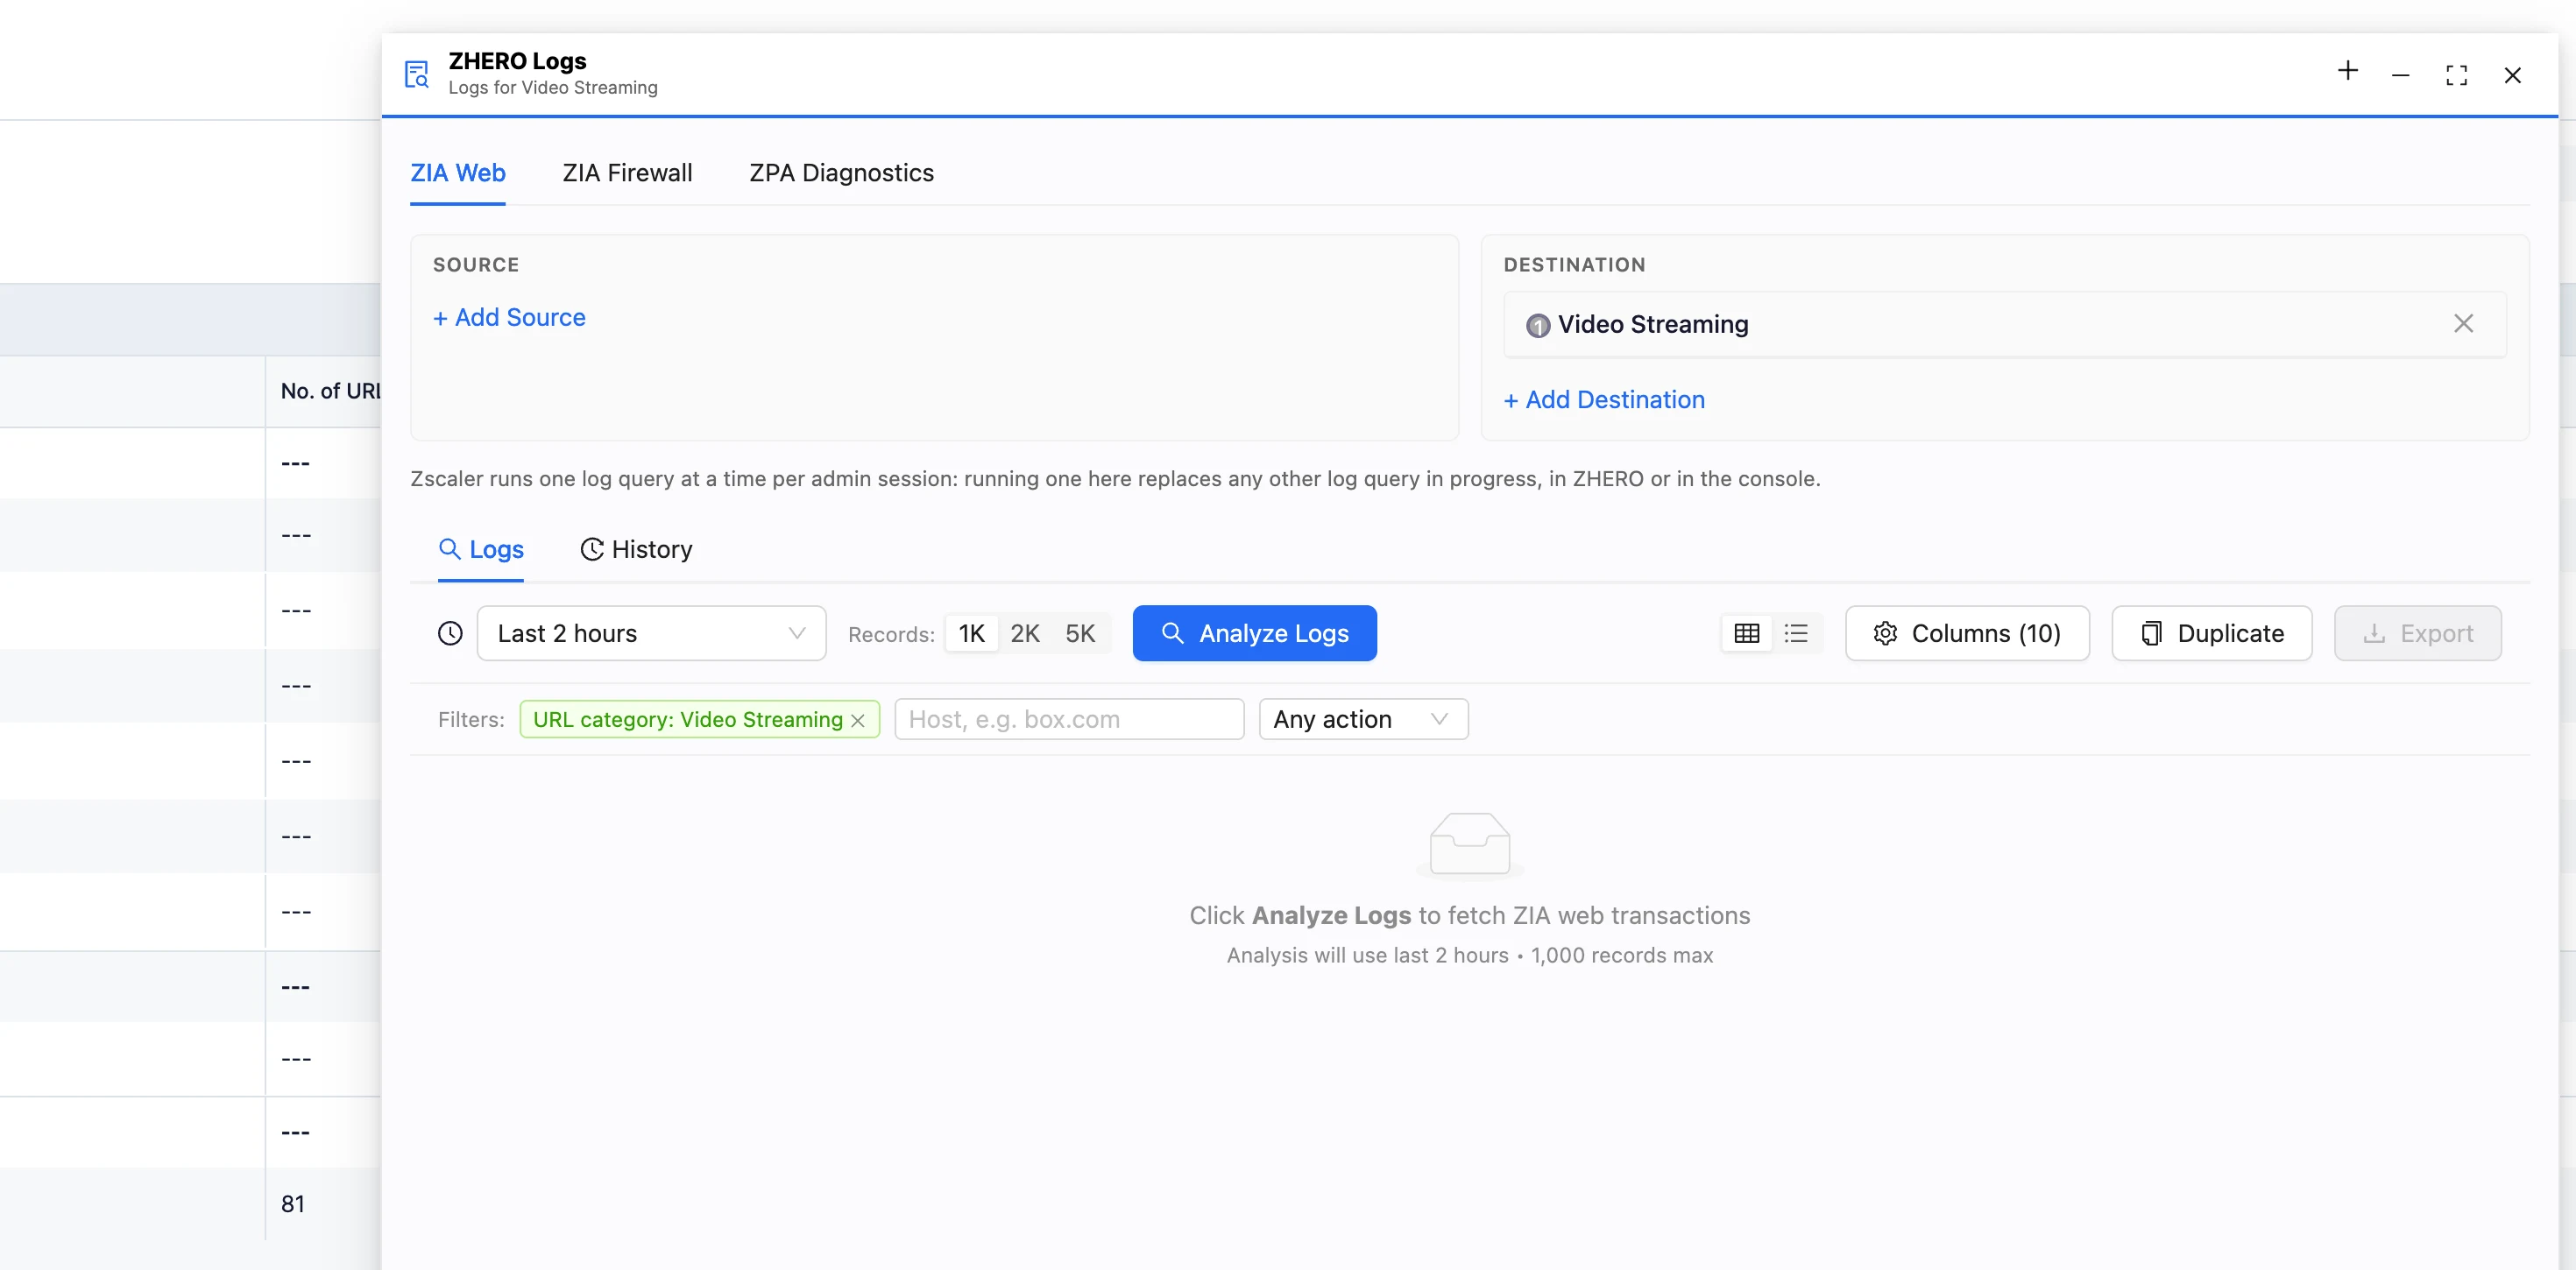
View Logs on a user, location, department, URL category, cloud app or rule opens ZIA Web, ZIA Firewall and ZPA Diagnostics logs in a movable panel, already filtered on that entity. Keep several panels open while you work in the console, triage with a Policy Action column and filters with value counts, export only the rows you filtered, and keep the queries that matter pinned in History.
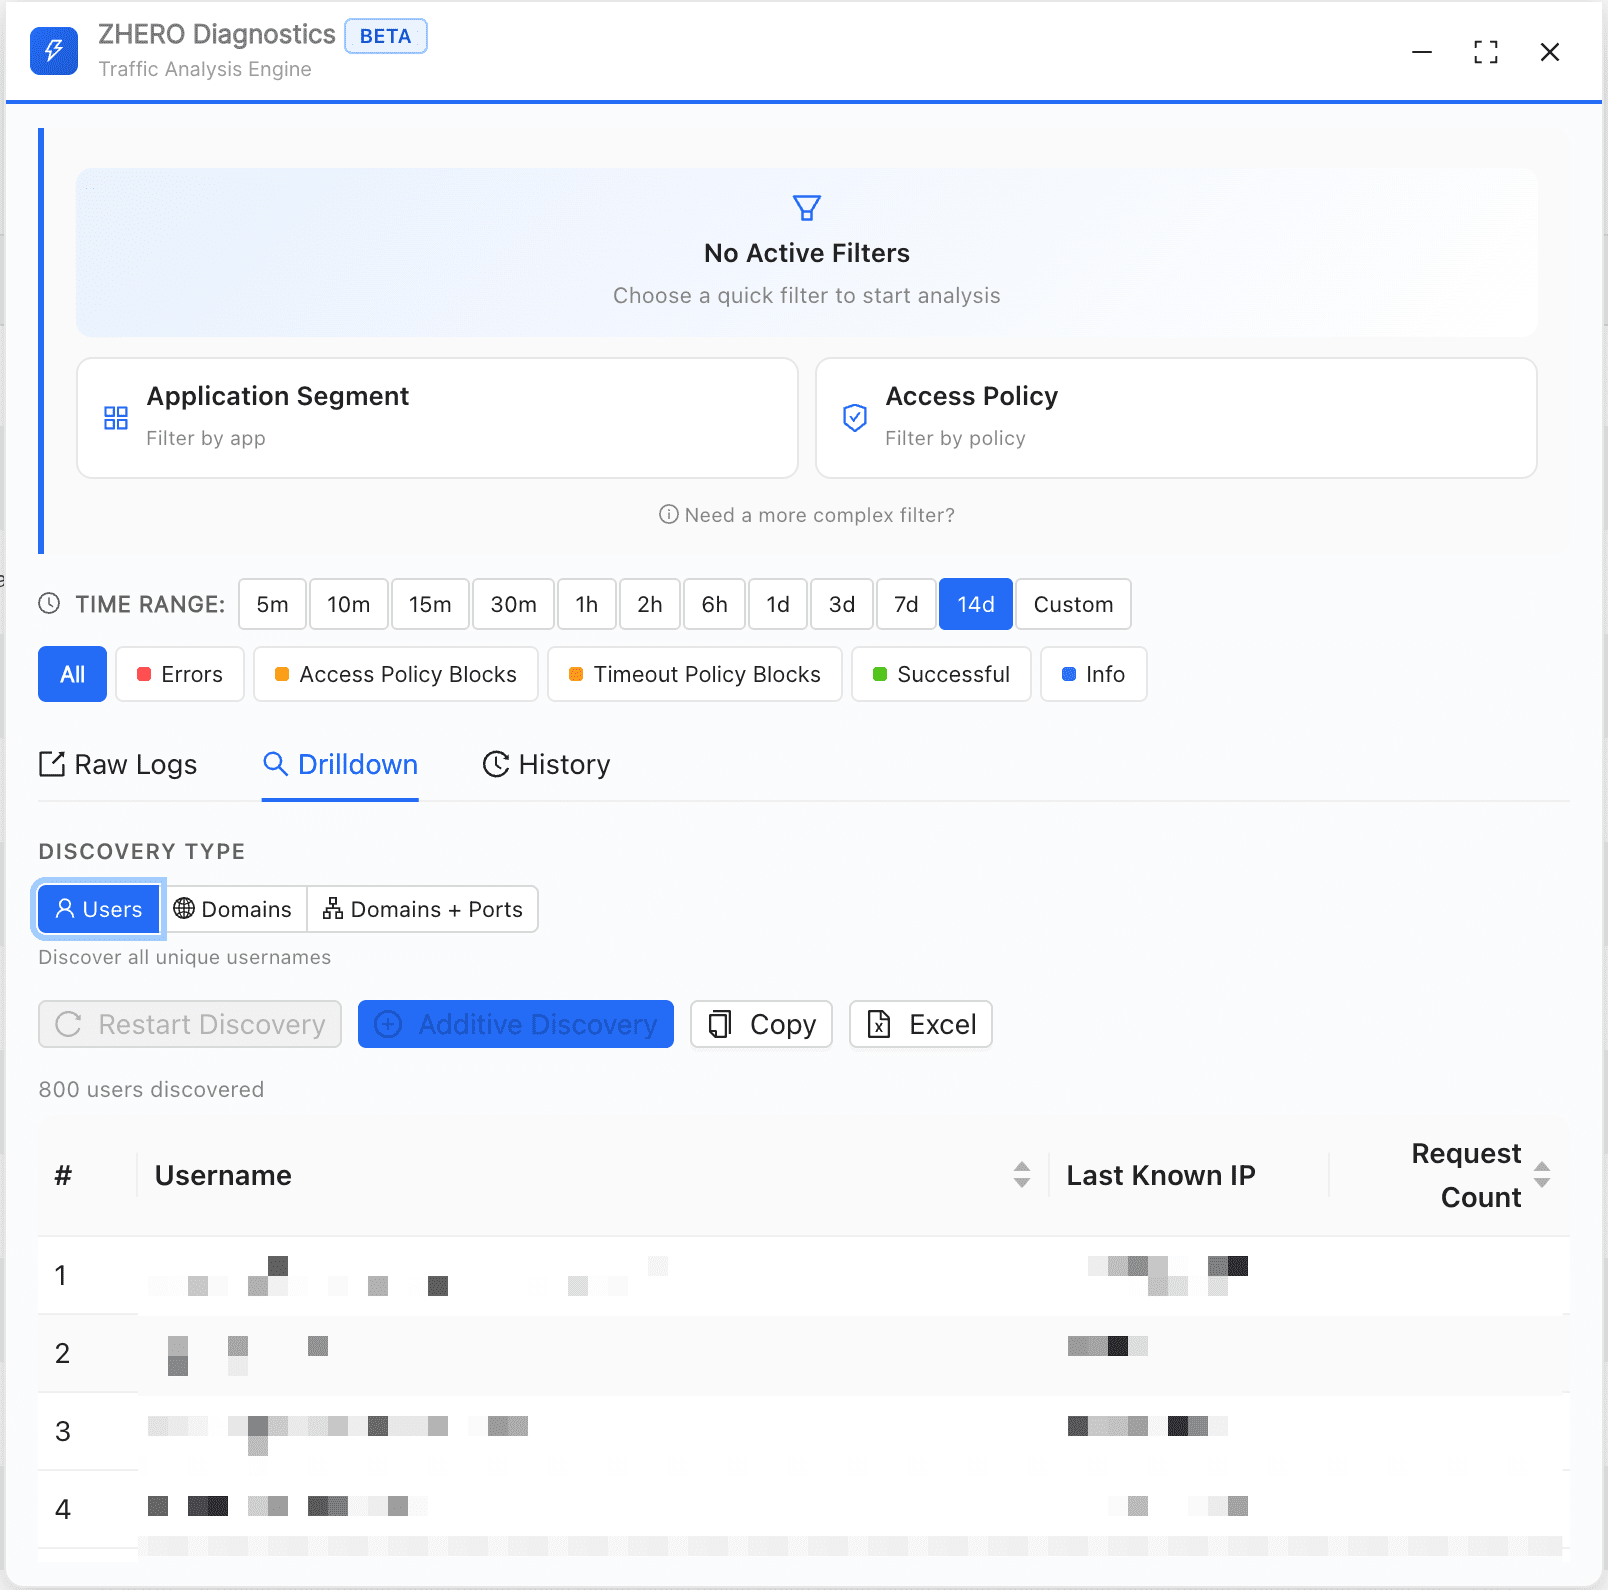
ZPA Diagnostics Engine
Raw ZPA logs become answers
Multi-dimensional drilldown across users, domains and domain:port combinations, with one-click Excel export running in the background. Raw diagnostic data becomes actionable intelligence without leaving the console, in its own panel or as a tab of the Logs panel.
Five investigation steps in one workflow
Step 1
Set criteria
Describe the ticket: user or group, department, location, device group, and the destination URL, category or cloud app. ZHERO turns them into scenarios.
Step 2
Read the verdict
For each scenario, reachable or blocked, and why: the path through each ZIA and ZPA engine, with the rule that decides.
Step 3
Analyze policies and flow
11 policy layers in one view with clear ALLOW and BLOCK indicators, and the forwarding path drawn as an interactive Sankey diagram.
Step 4
Prove it in the logs
Query the real ZIA and ZPA logs for the scenario, or run a guided investigation around the time on the ticket.
Step 5
Save and hand over
Name the session, pin the queries, and let the next engineer resume exactly where you stopped.
Without ZHERO vs With ZHERO
Questions, answered
Does my traffic data leave the browser?
Does the Troubleshooting Engine cover ZPA as well as ZIA?
Is Investigation & Diagnostics fully released?
Does ZHERO run log queries on its own?
Can I export the results?
Investigation & Diagnostics in action
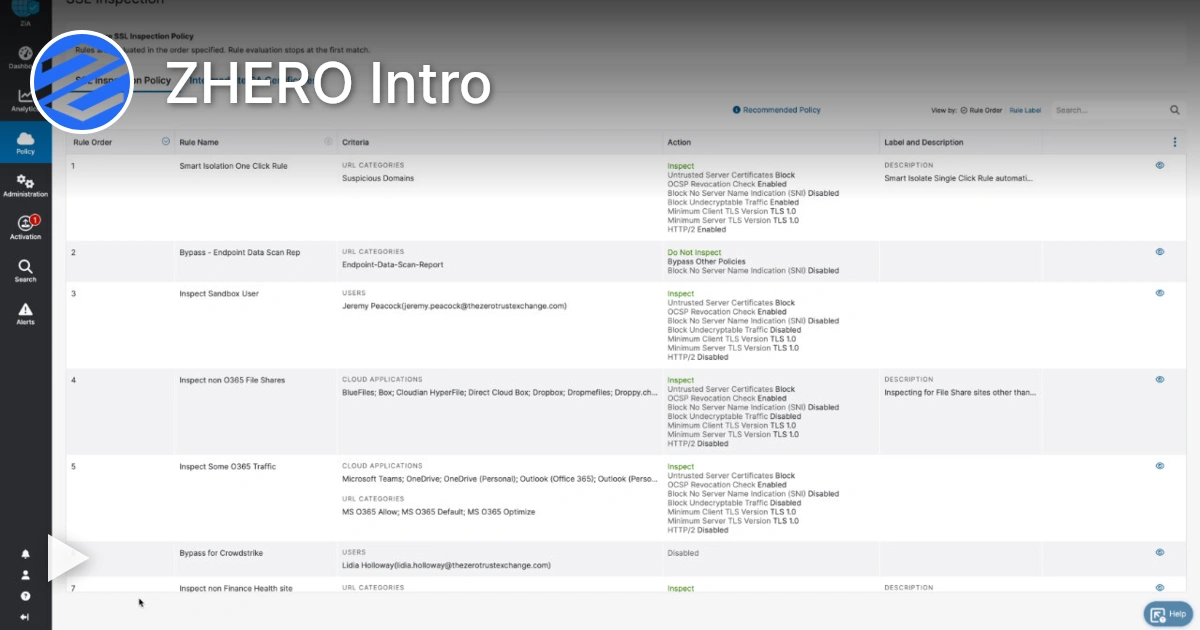
Watch a 4-minute demo.
Ready to see Investigation & Diagnostics in your tenant?
Start Your Transformation!
Install in two minutes. No servers, no migration, no training.