App profiles, forwarding profiles, PAC files: the assessment nobody wanted to do
Three intertwined Zscaler Client Connector configurations, never readable side by side. ZHERO scores every combination and weights it by real device counts.
Assessing a Zscaler Client Connector fleet means reading three configurations that depend on each other: app profiles, forwarding profiles and PAC files. They live on different screens you cannot open side by side, and nothing tells you which ones your devices actually run. ZHERO scores every combination against best practice, weights it by real device counts, and turns the result into a prioritized recovery plan.
The part of the assessment nobody wanted to do#
Most of what we do at ZHERO started as consulting work on tenants that had been around for years, passed through several partners and several internal teams, until somebody asked for a proper check-up of the configuration.
Every one of those assessments had one section that arrived, had to be done, and that nobody ever wanted to open: Client Connector. App profile, forwarding profile, PAC file.
The reason is mechanical, not emotional. Those three are intertwined. The app profile specifies a forwarding profile, and the forwarding profile can call three or four PAC files. Each one sits on a different screen of the console, and you cannot keep more than one of those screens open at a time. Each app profile carries dozens of parameters, the forwarding profile carries dozens more, and comparing them by hand means writing down values, flipping screens, and hoping you did not misread a toggle.
You also do not know how the fleet actually uses them#
Even if you manage to read all of it, you still do not know what matters. Profiles are policies, assigned and distributed by group across thousands of users. Knowing which ones are actually in play means going to Enrolled Devices, taking a separate CSV export, converting it to Excel, building a pivot table, and cross referencing the number of clients per app profile.
Only at the end of that do you start to have statistics: who is on Z-Tunnel 1.0 and who is on 2.0, how each group is configured, what is missing, how many devices sit behind each profile. It is a day of work to produce a table that should have been a screen.
Two scores, and the distance between them is the point#
ZHERO scores every combination of app profile, forwarding profile and PAC file against best practice, then rolls those up two different ways.
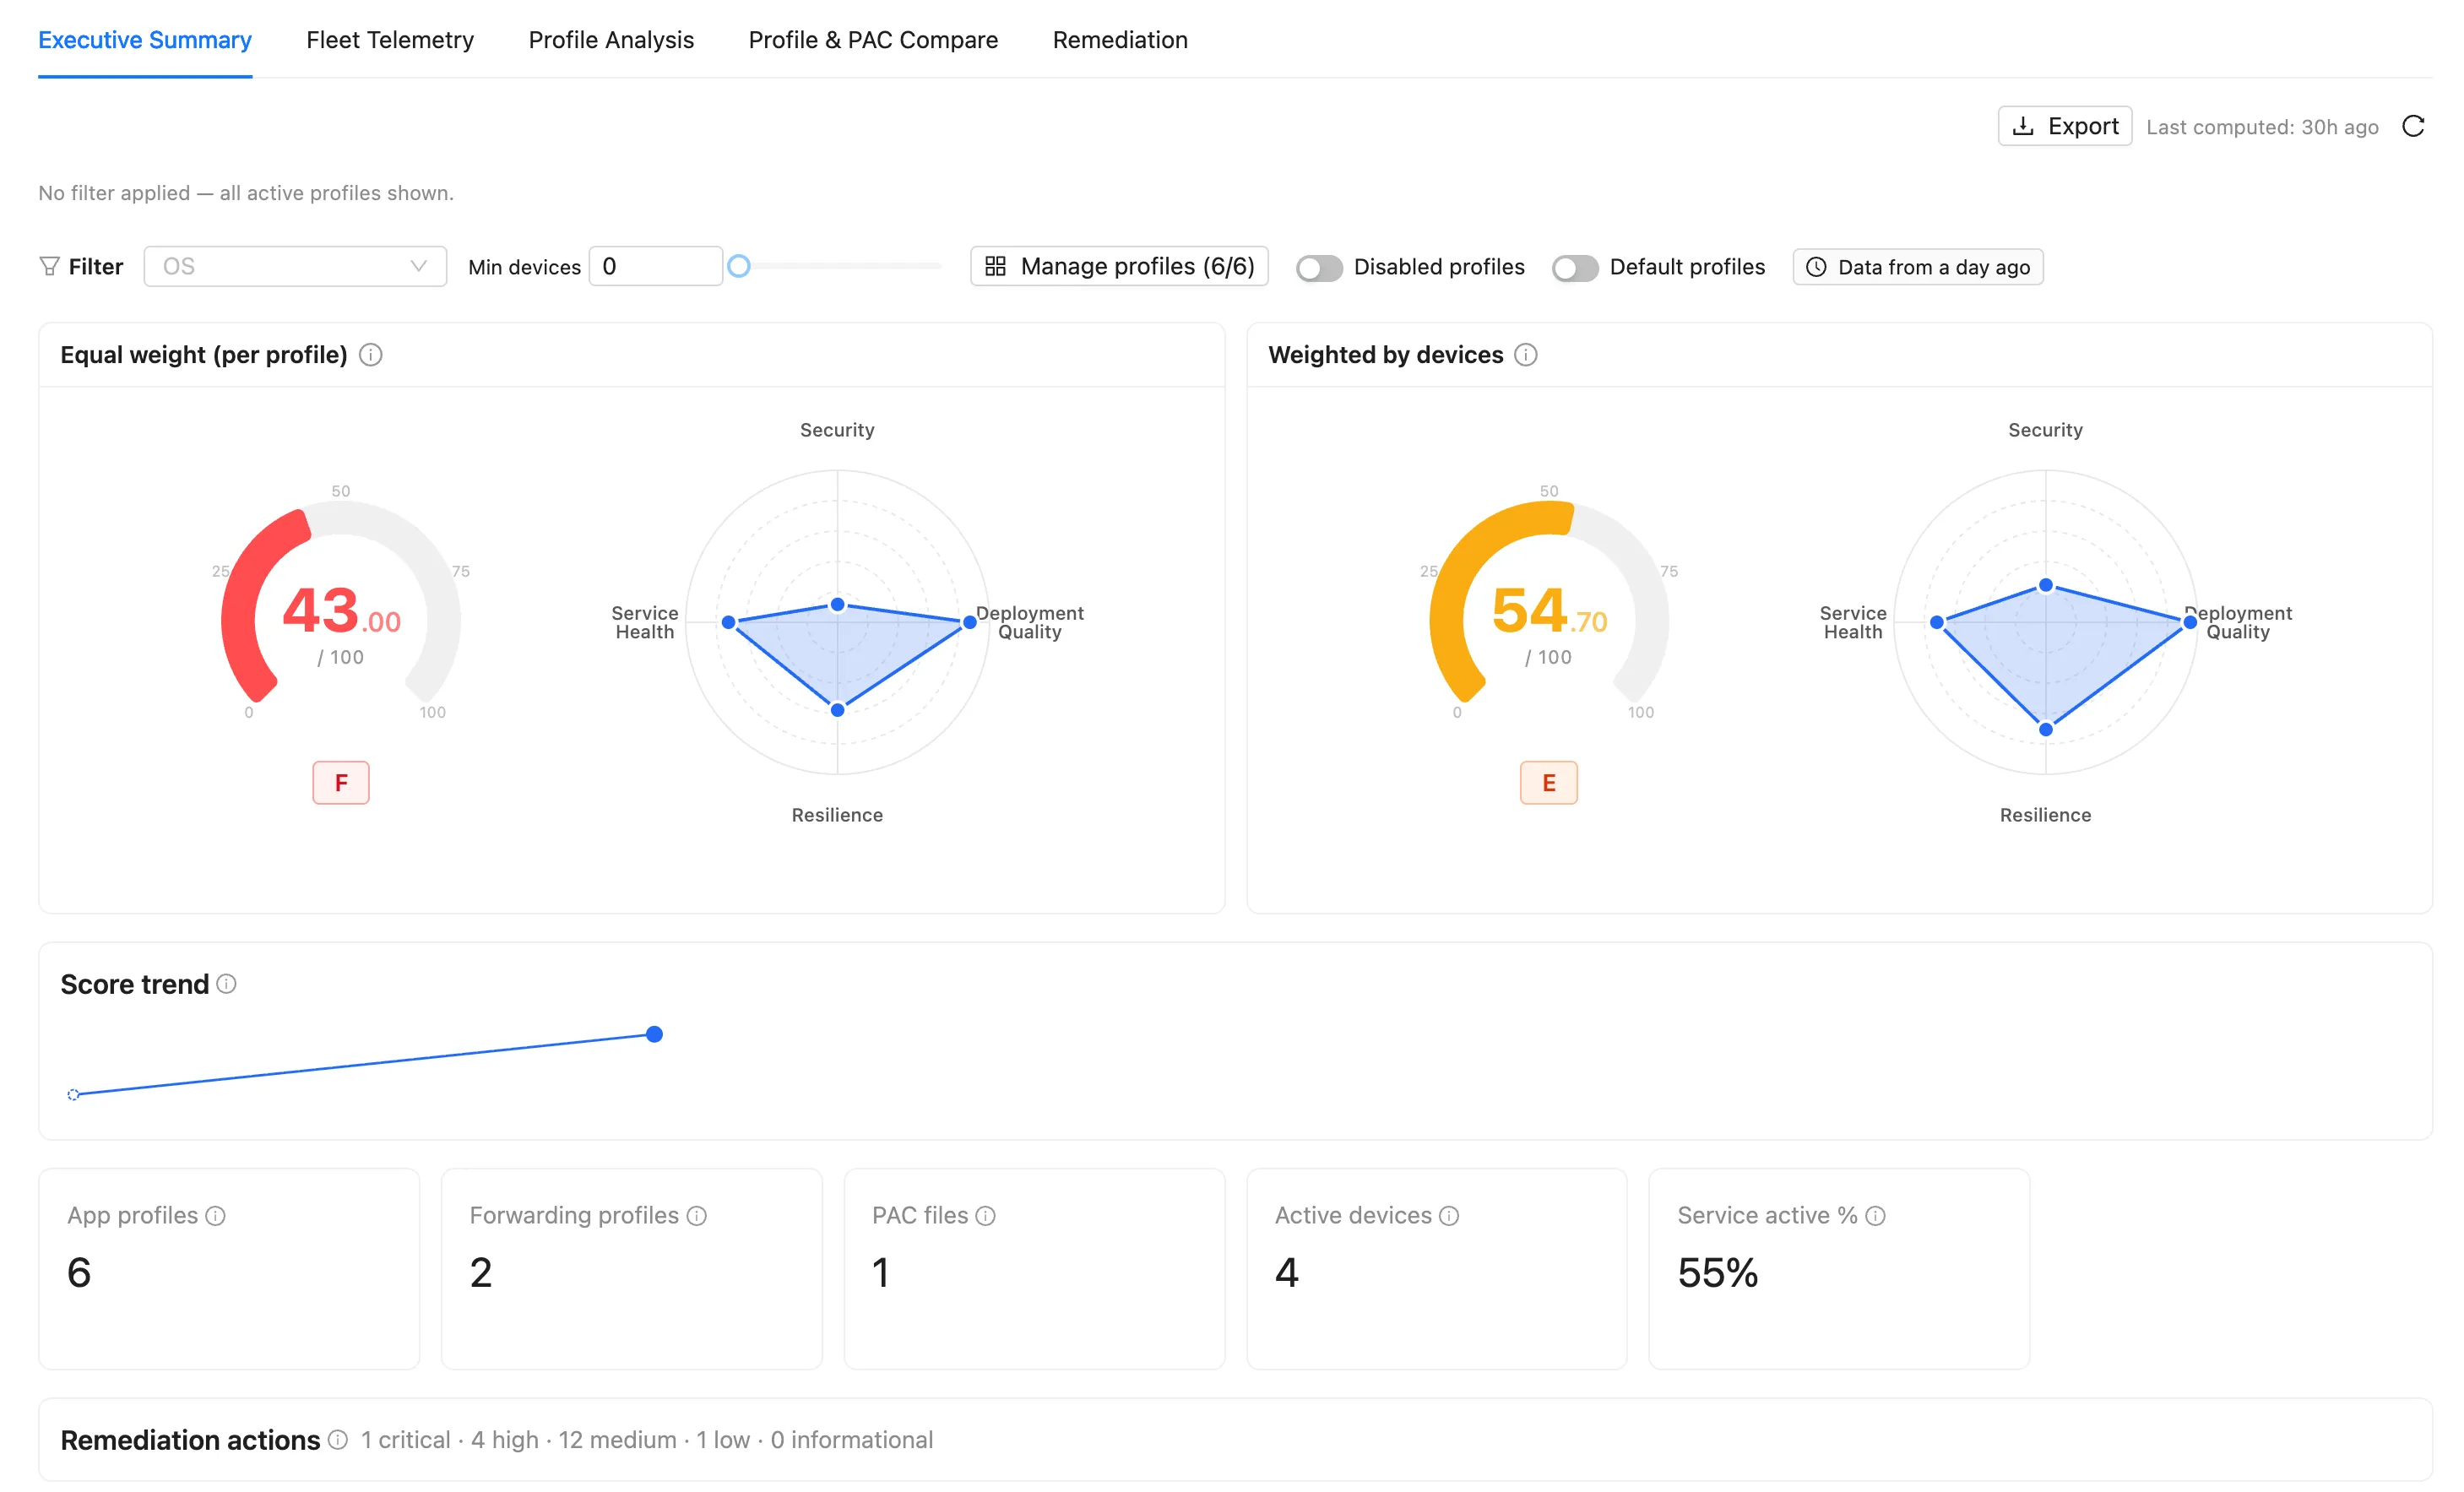
Equal weight (per profile) treats every combination the same. It answers “how good is this configuration in principle”, which is the question an auditor asks.
Weighted by devices counts how many devices actually run each combination. It answers “what is my fleet really experiencing”, which is the question that decides what you fix on Monday.
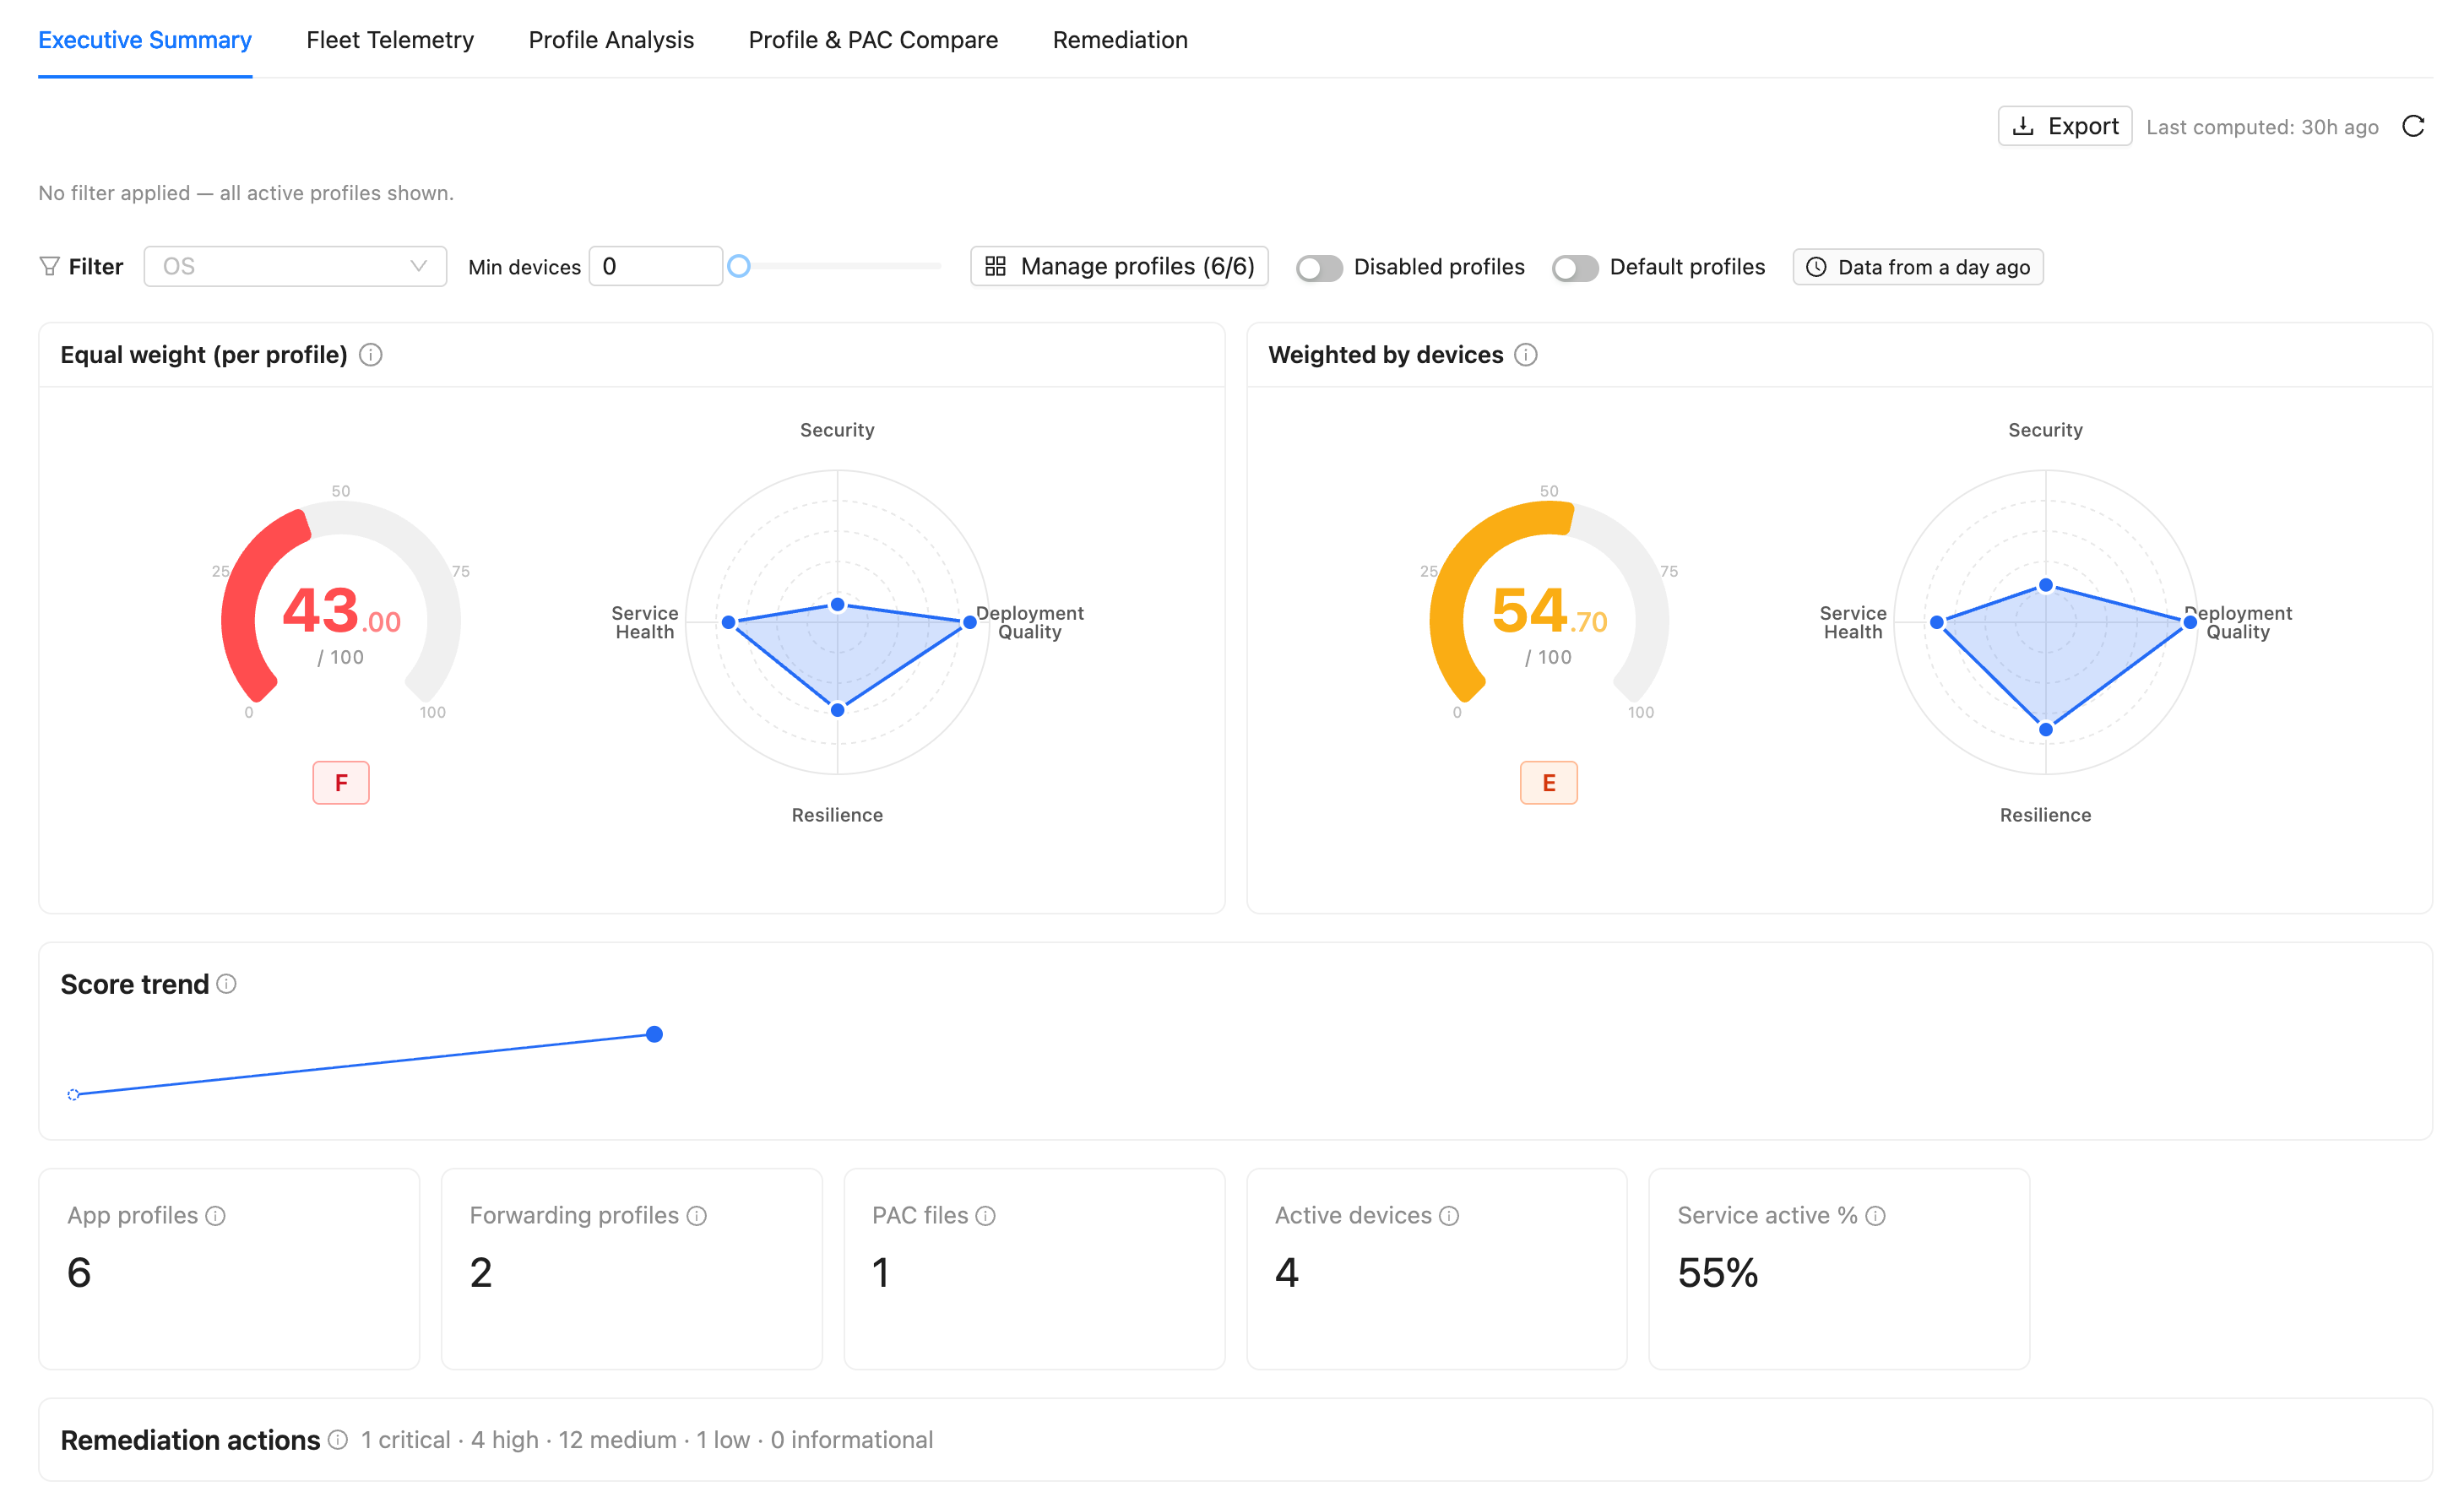
On the tenant in the screenshot the two numbers are 43.00 (grade F) and 54.70 (grade E). Same configuration, eleven points apart.
They drift apart because device distribution is never even. A sloppy profile with four devices on it and a solid profile with four thousand are the same row in the first number and very different rows in the second. When the weighted score is the higher one, your worst configurations are mostly unused and the cleanup is cheaper than it looks. When it is the lower one, the profile most of your fleet runs is the one with the gaps, and that is a different Monday.
Each score comes with the same four verticals: Security, Deployment Quality, Resilience and Service Health. The radar tells you which of the four is dragging the number down before you open a single profile.
One click, and ZHERO does the download#
Two clarifications, because both get assumed the wrong way round.
You do not upload anything. ZHERO downloads the enrolled device and device status data itself, processes it, and folds it into the weighted score. There is no spreadsheet step.
And it is not silent background magic either. You click a button to run the assessment, because the computation is genuinely heavy and it needs an explicit go from you.
What the heatmap shows that a spreadsheet never did#
The comparison view is where the three intertwined configurations finally sit on one screen. A coverage heatmap puts every profile on a row and every best practice check on a column, grouped by app profile, forwarding profile and PAC file, then a summary sorts the checks worst first.
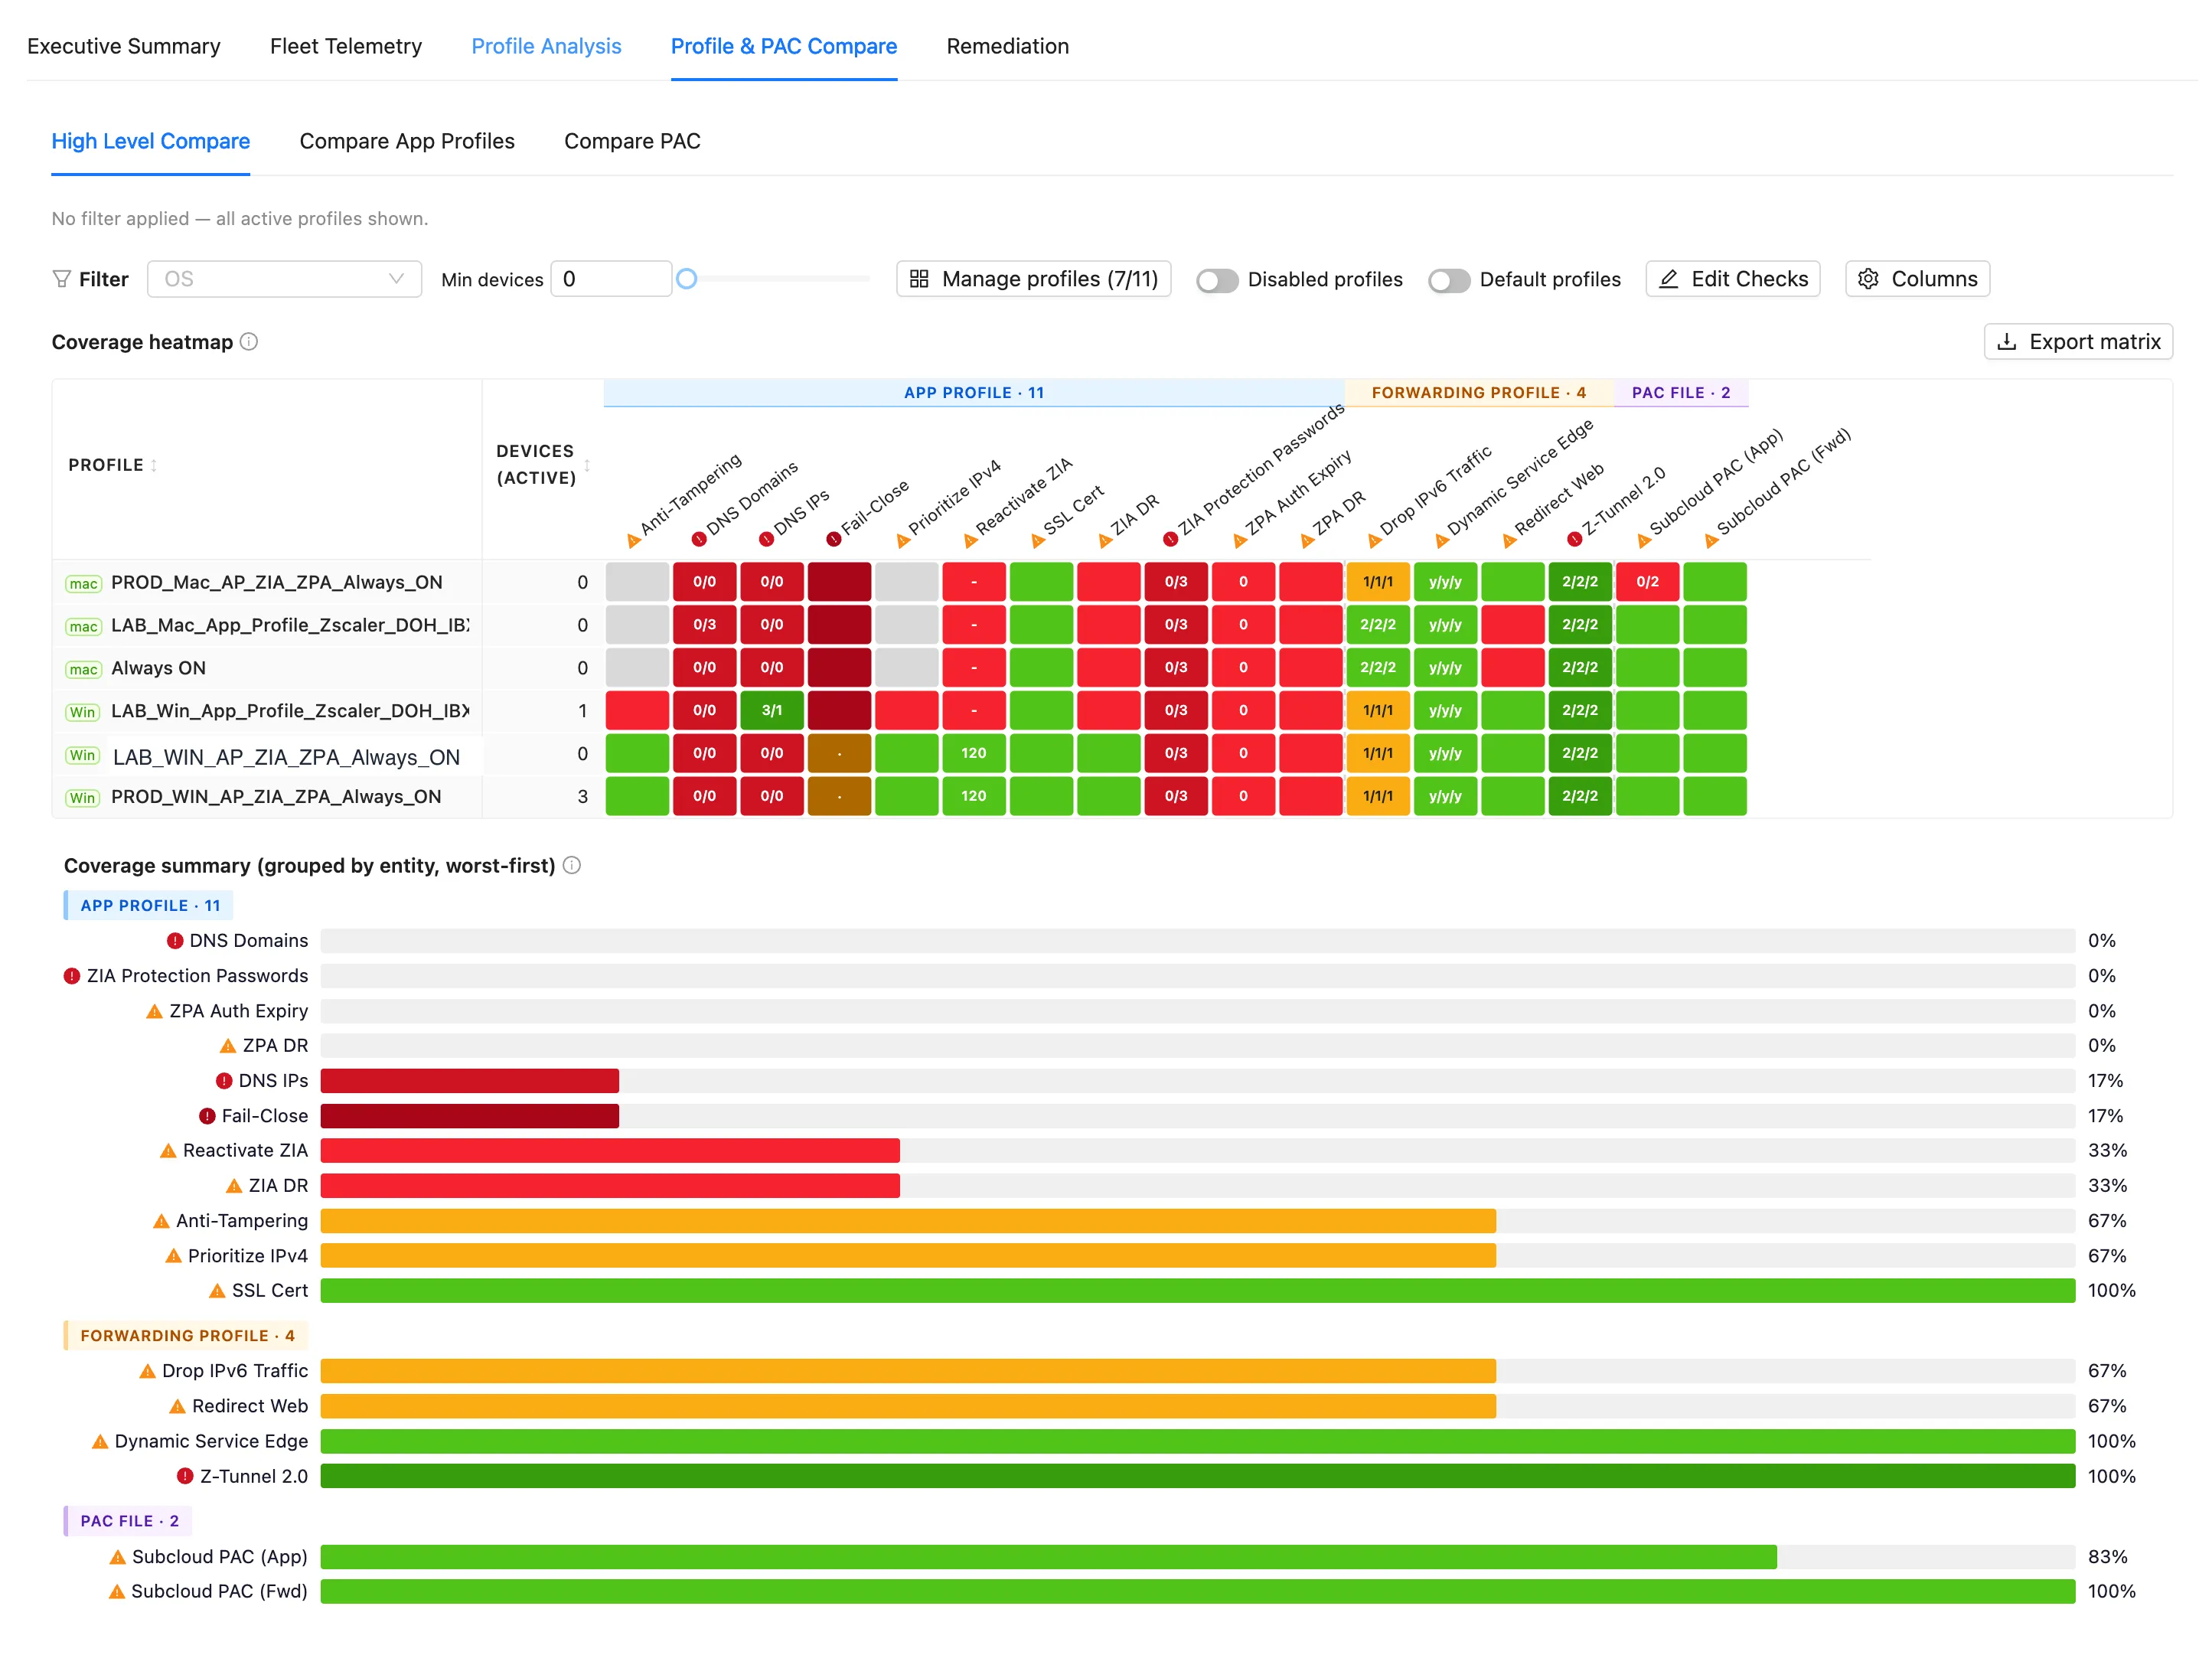
You read it in a few seconds: this fleet has no DNS Domains configured anywhere, no ZIA protection passwords anywhere, Fail-Close on one profile out of six, and Z-Tunnel 2.0 everywhere. Two of those are a five minute fix that lifts the whole fleet.
From there you go one level deeper. Compare App Profiles puts the raw settings of several
profiles side by side as a pivot, DNS tunnel ranges and packet tunnel excludes included,
with the raw JSON diff underneath. Compare PAC does the same across PAC files, and it tags
what it recognizes: a broad-bypass label on a subnet that sends far more traffic direct
than anybody intended is the kind of thing that survives for years precisely because nobody
ever lined the files up.
The devices tell you things nobody would ever look for#
The other half of the picture comes from device state, and this is where the assessment stops being hygiene.
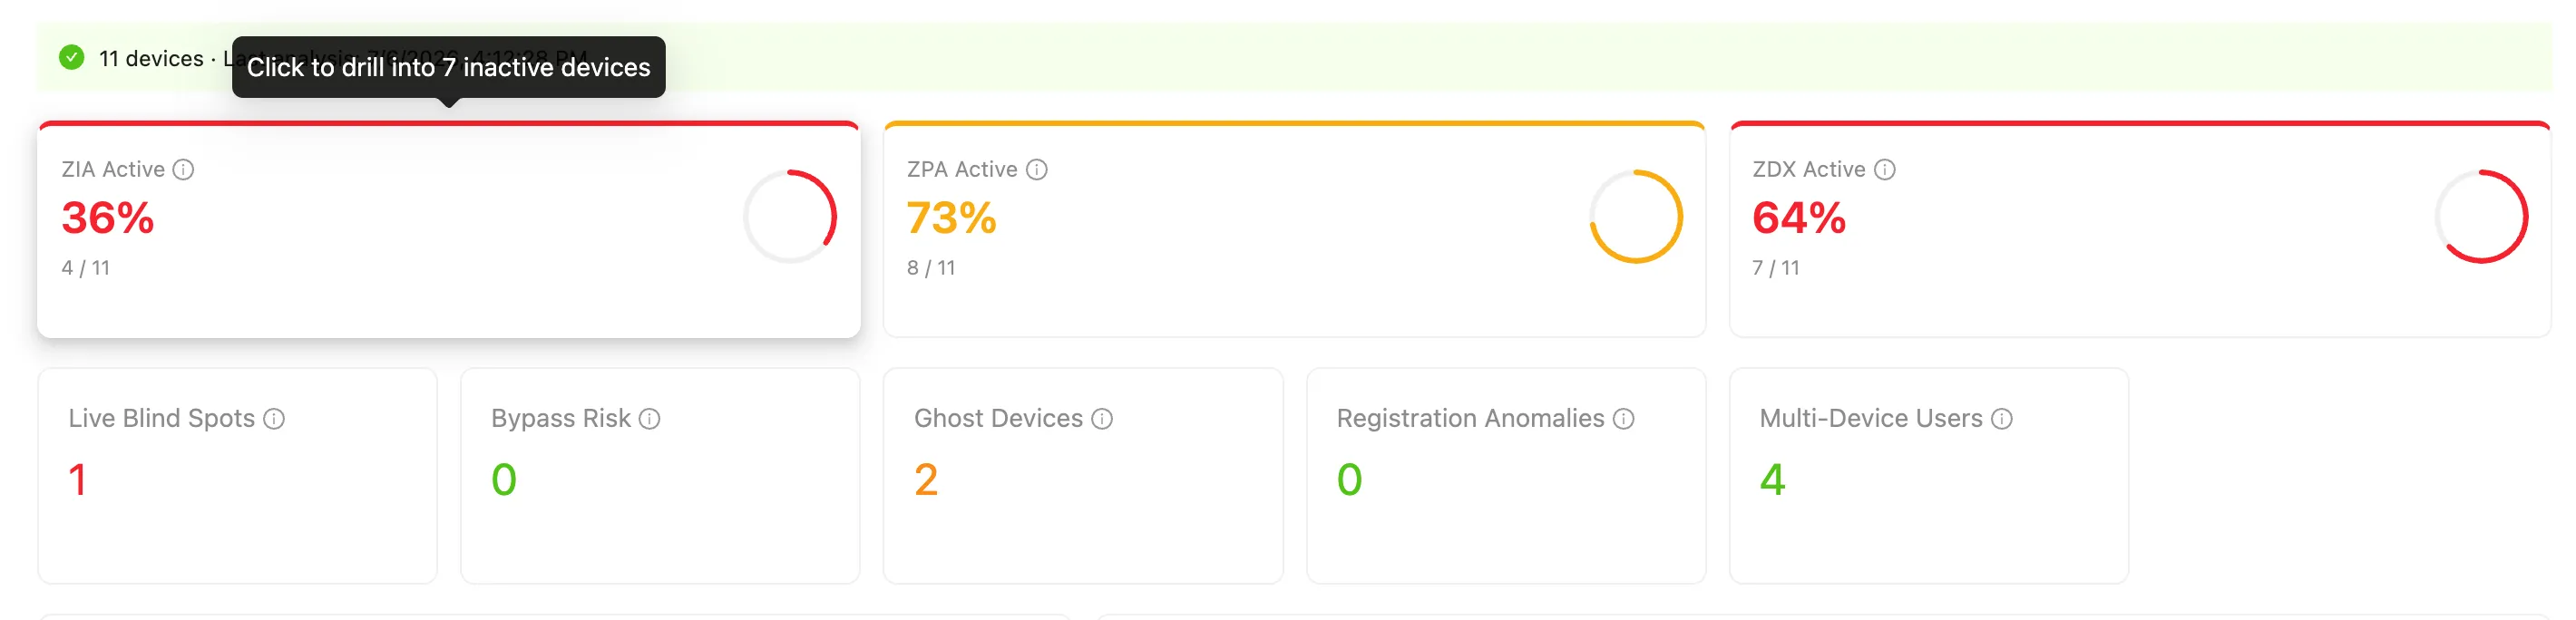
ZIA Active is the one to look at first. Not “is ZIA licensed”, not “is ZIA in the profile”, but: on how many enrolled devices is the service actually running right now. The gap between those three questions is where the interesting findings live, next to Live Blind Spots, Ghost Devices, Registration Anomalies and Multi-Device Users.
Here is why that matters, from a real engagement, told as a composite and anonymized.
A customer with about 16,000 users had done the responsible thing: they had set a password in the profile so users could not switch ZIA off on their own. What they had not set was the option that turns ZIA back on automatically after a number of minutes (it accepts anything from 1 to 1440). And at some point, the way these things go, the disable password had leaked.
Nearly 1,000 devices had ZIA switched off. Some for days, some for months. Nobody knew, because nothing in the console adds that number up for you, and the team was confident they had an excellent configuration. They were not wrong about the configuration. They were wrong about the fleet.
That same customer had been hit by attacks that got through. I cannot draw a line from one fact to the other, and I am not going to pretend otherwise. But a thousand unprotected laptops is a question worth asking out loud.
From findings to a plan you can actually work#
A list of everything wrong with a fleet is not useful on its own. The remediation view turns it into an ordered plan.
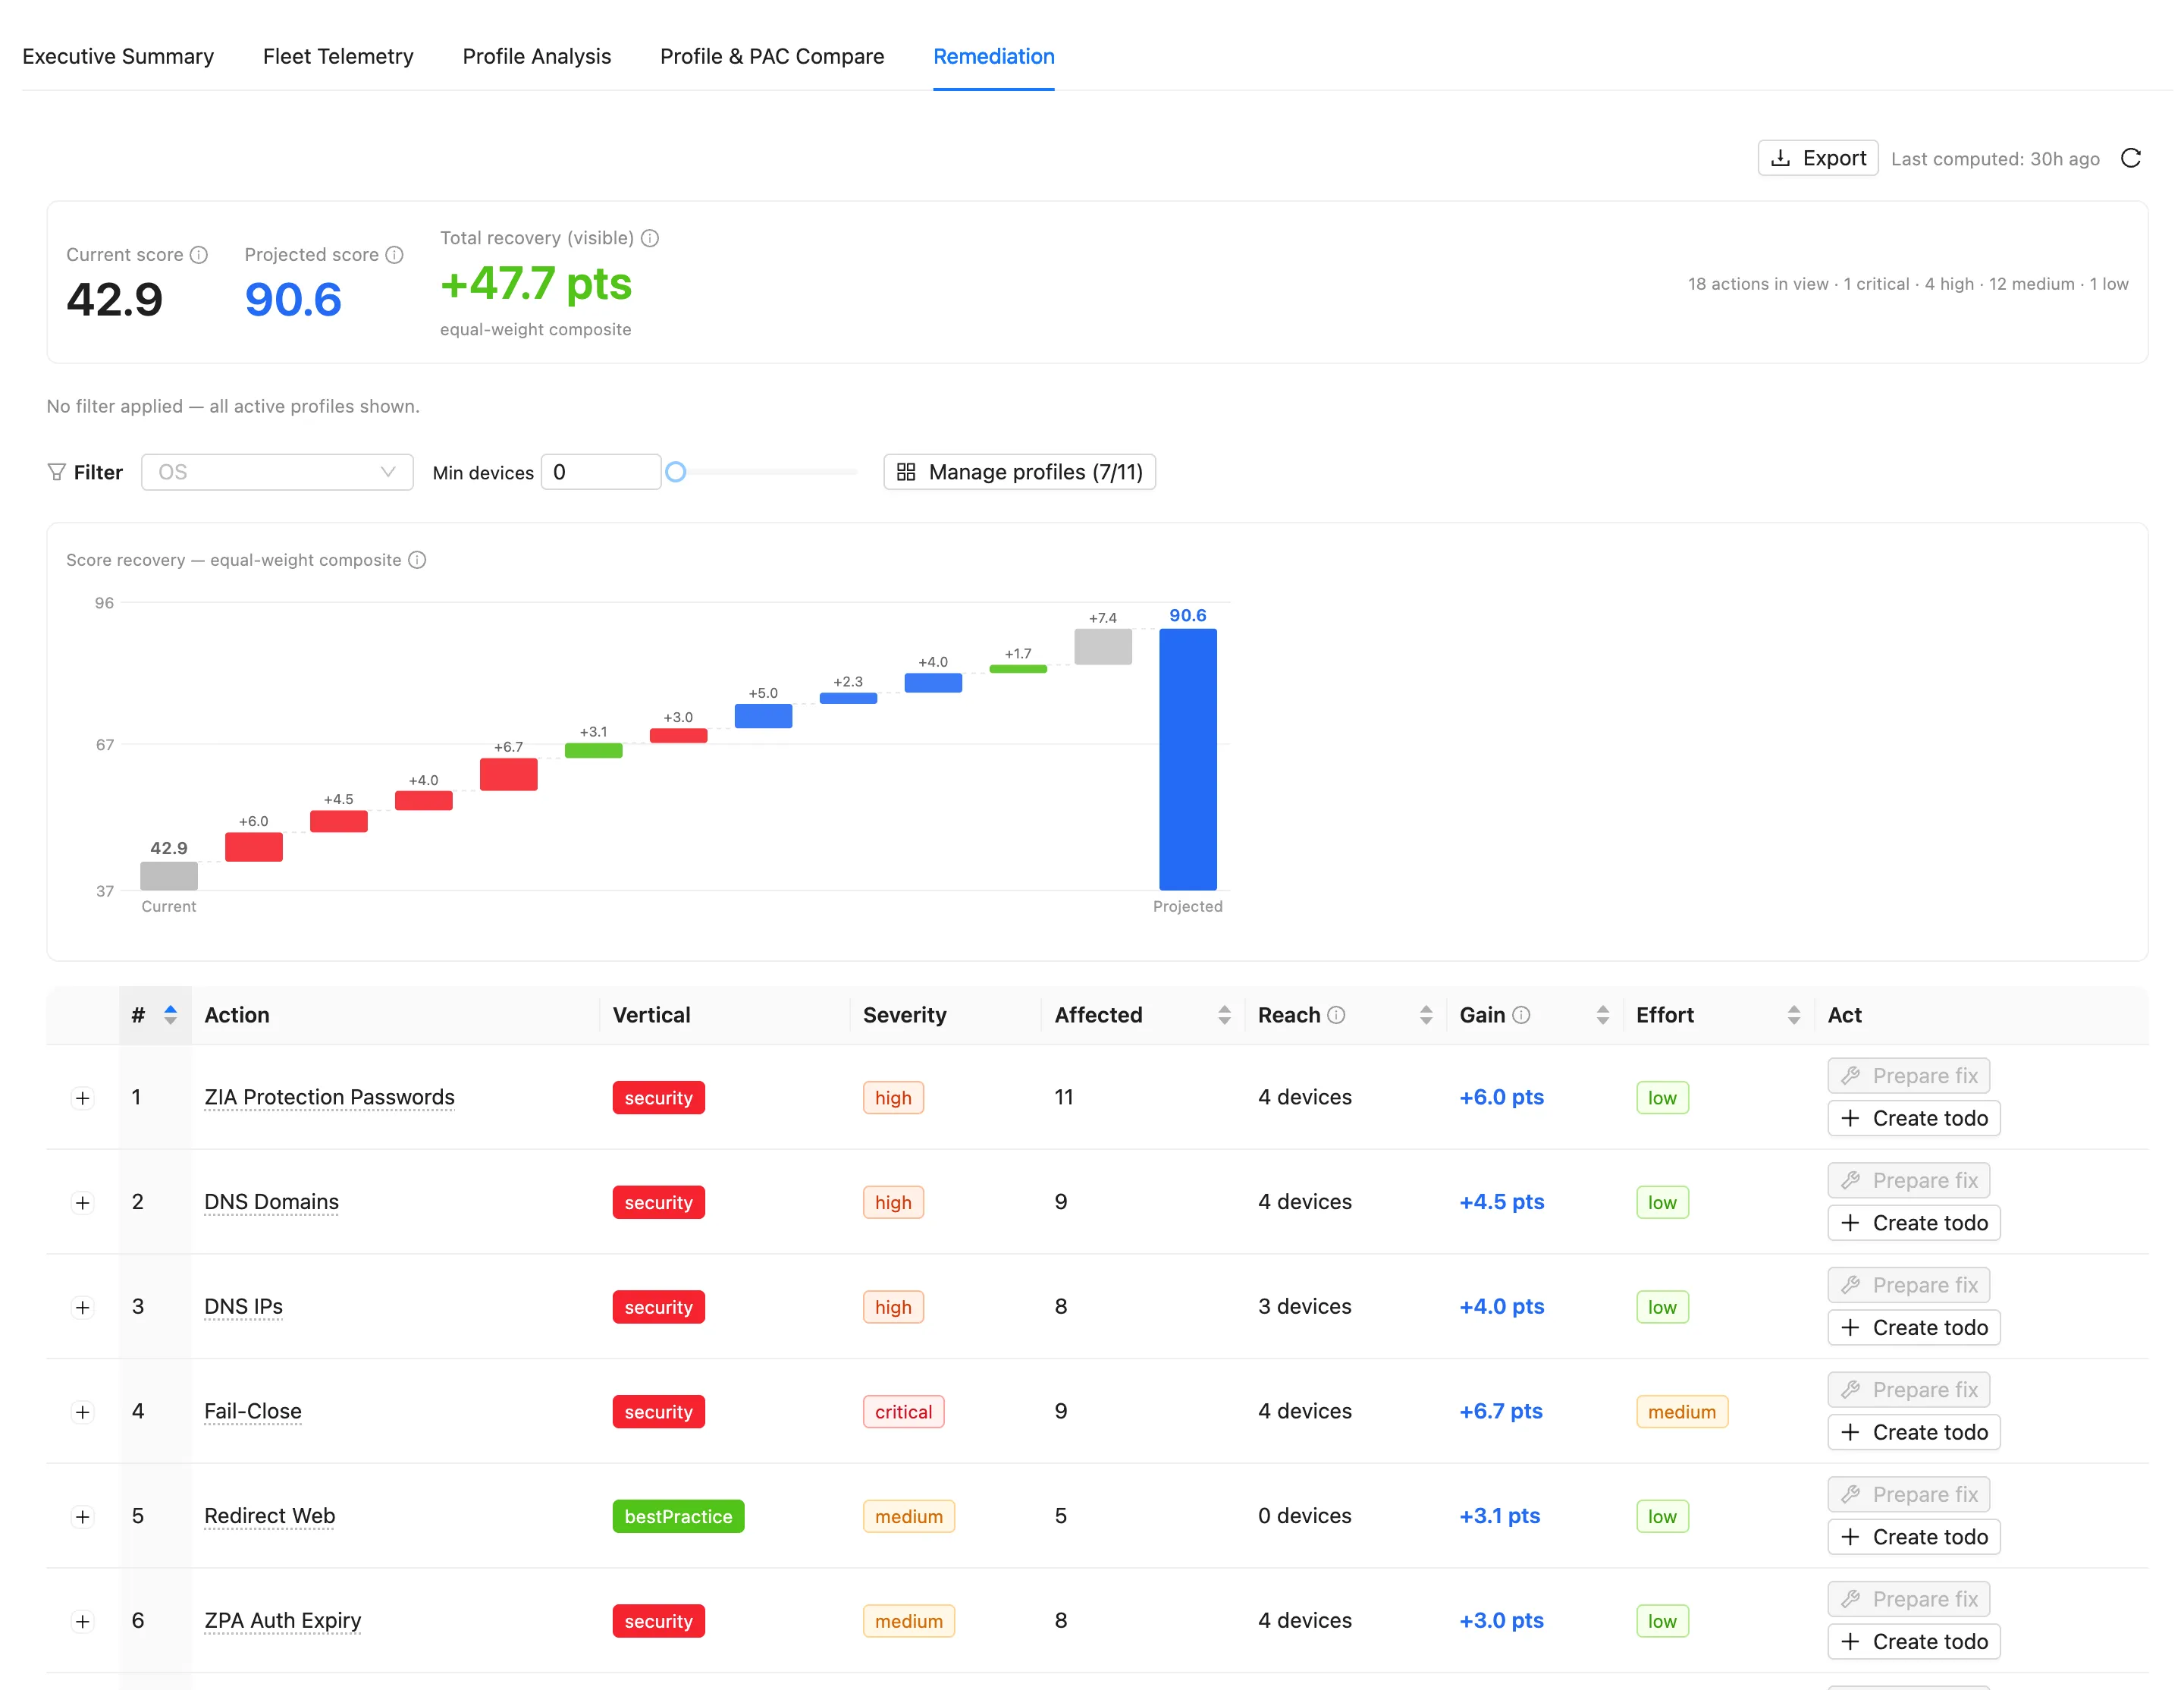
The Score Recovery Waterfall shows what the composite becomes if you work the list: on this tenant, 42.9 today and 90.6 after eighteen actions. Every action carries its vertical, its severity, how many profiles it affects, how many devices it reaches, how many points it is worth and how much effort it costs. Sort by gain over effort and the first three rows are your afternoon.
Each row also has a button that matters more than it looks: turn the finding into a to-do assigned to whoever owns that part of the tenant. That is the same shared to-do system the rest of ZHERO writes into, so the assessment does not end as a PDF somebody files. The change itself is applied in the Zscaler console; ZHERO tells you which one, in what order, and what it is worth.
Why this is security, not housekeeping#
It is worth being explicit about the stakes, because “client configuration” sounds like housekeeping and it is not. App profiles, forwarding profiles and PAC files decide how much traffic gets inspected and how much walks past. Too many exclusions in a PAC file, too many VPN gateways, ZIA that can be switched off and never comes back on, DNS traffic that never reaches the right resolver, fail-close left open, no disaster recovery path: none of those show up as an alert. They show up as a quiet reduction in how much of your fleet is actually protected.
In practice this is recursive across almost every tenant we look at. Genuinely good Client Connector configuration tends to appear only where somebody competent deployed it from scratch and nothing has been added since. That is rare, and it has nothing to do with how good the team is: it is what happens when three intertwined configurations can only be read one screen at a time, for years.
The ZCC layer gets its own vertical inside the wider Security Posture score, next to ZIA and ZPA, for the same reason. It belongs to both products, so without a number of its own it disappears into an average. If you want the full logic of how the scoring works, that is in the post on the posture score.
Frequently asked questions
What is ZCC Fleet Health?
It is the part of ZHERO that reads your Zscaler Client Connector configuration as one picture: app profiles, forwarding profiles and PAC files, scored against best practice, plus the telemetry of the devices actually running them. You get a composite fleet score, a coverage heatmap across every profile combination, side by side comparison of profiles and PAC files, and a prioritized remediation plan.
What is the difference between the equal weight score and the weighted by devices score?
Equal weight (per profile) treats every profile combination the same, so it tells you how good your configuration is in principle. Weighted by devices counts how many devices actually run each combination, so it tells you what your fleet is really experiencing. The two numbers often differ by several points, and the distance between them is itself a finding.
Do I have to export and upload a CSV myself?
No. You click one button to run the assessment, because the computation is heavy and it needs an explicit go. From there ZHERO downloads the enrolled device and device status data for you and processes it. There is no spreadsheet work and no manual upload.
Is ZCC Fleet Health available in the classic admin portals?
No. It runs only in the Zscaler Experience Center, which is where the APIs that expose this data live. If your team still works mainly in the classic ZIA and ZPA portals, Experience Center is the console to open for this assessment.