Inside your console, not another tab
ZHERO runs inside the Zscaler admin console as a browser extension. One switch above the policy table turns it on, and the same switch turns it off.
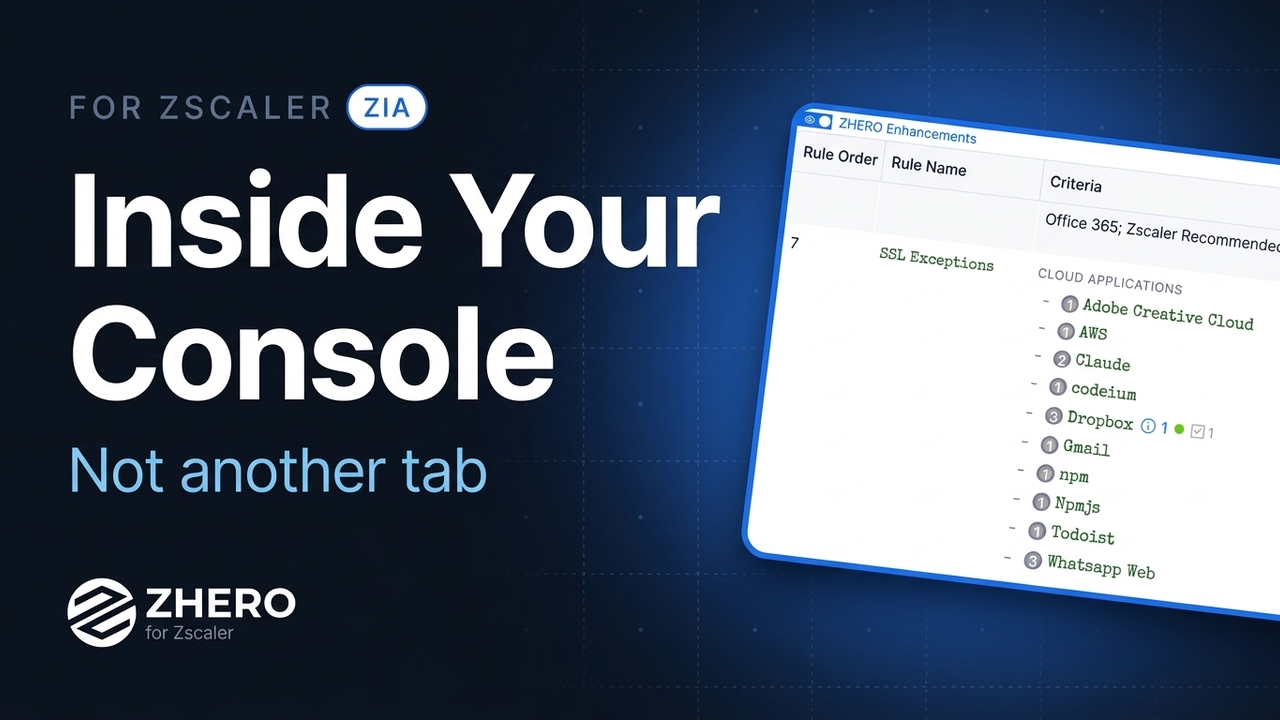
ZHERO is a browser extension that runs inside the Zscaler admin console. There is no second console to learn, no separate login and no copy of your configuration to keep in sync. A switch above each policy table turns the enhancements on, and the same switch turns them off again, so the question “is this another tab” has an answer you can watch in forty seconds.
The question this answers#
Ask anyone who has run a Zscaler tenant for a few years what happened to the last platform that promised visibility on top of their console. Usually the same thing: it became a second place to look. A second login, a second set of screens, a second copy of the configuration that was correct on the day it was imported and drifted afterwards. Two sources of truth, and the one people trust is always the console.
So the useful answer is not an argument, it is a gesture.
The screen in the video is Zscaler’s SSL Inspection Policy, exactly as it renders for you today. Same page, same tenant, same table. Then the ZHERO Enhancements switch above the table goes on, and every entity in every rule starts carrying what you would otherwise have gone looking for. Then it goes off again, and it is a plain Zscaler table.
Badge, hover, drawer: three levels of the same answer#
Wherever the console shows an entity, a URL category, a location, a user group, an application segment, ZHERO adds three progressive levels of information. You choose how deep to go by how long you look at it.
The badge. A usage counter rendered inline next to the entity: how many policies use it. It reads from local data, so it appears with the page rather than after a round trip. The most common question about any object in a mature tenant, “is this still used”, is answered before you click.
The hover card. Hover the entity and you get its configuration, the policies that use it, recent traffic where Zscaler exposes it, and when it last changed. No second tab, no navigating away from the rule you were reading.
The drill-down drawer. Click, and the entity opens in place. For a URL category that means its URLs and keywords, the policies that use it, the findings on it and its collaboration thread. The traffic behind it is fetched on demand, up to 180 days, when you ask for it rather than on every page load.
There is a detail in the policy lists worth knowing, because it is usually the answer to “why does this user have this access”. Each usage is marked by how it happens: D when the entity is named directly in the policy criteria, G when it arrives through a group the policy names, and A when it is covered indirectly by an Any criterion. A rule that grants access through an Any criterion looks like a rule that grants nothing in particular, until somebody marks it.
On the SSL Inspection page, specifically#
The page in the video is not decorative. Everything ZIA does to encrypted traffic depends on being able to read it, so the share of traffic you actually inspect is the number the rest of your posture rests on.
On that page ZHERO adds two rings in the top right corner: the SSL Scan Enabled Locations Percentage read from Zscaler’s own Security Policy Audit Report, and the qualified inspection rate computed from your last 30 days of web logs. A chart button opens the trend behind it, up to 180 days. The SSL Inspection Coverage page of the manual explains what that rate counts and what it deliberately excludes.
So the enhanced table and the measured rate sit on the same screen: the rules that decide what gets inspected, and the number that says how well they are working.
Why it cannot be out of date#
This is the part that the toggle makes obvious and that a feature list never does.
An overlay that reads the console you are looking at cannot show you a stale tenant, because it is not showing you a copy. There is no import window, no sync job that failed quietly overnight, no “last refreshed” timestamp to interpret. When another admin changes a rule, you see the changed rule, because you are on the Zscaler page that renders it.
It also means the security question has a short answer. ZHERO reads your configuration through your own authenticated session and processes it in the browser: your configuration never leaves your device. The details are on the local processing page.
What this changes in practice#
The badges and the drawer are not a nicer way to read the console. They remove an entire category of work: the hop. Opening another product to check whether an object is used, keeping seven tabs open because the answer spans two policies, writing down an object name to look it up later. That work does not appear on anyone’s ticket, which is exactly why it never gets measured.
The broader case for this is in the mental list every Zscaler admin carries: the work you never do because it is too expensive to start. Making the tenant readable in place is how items leave that list.
The same pattern runs through every surface in Enhanced Visibility, from the policy tables to universal search.
Bring your own tenant to a demo and we will turn the switch on in your console, on a page you choose. About an hour.
Frequently asked questions
Is ZHERO a separate console?
No. ZHERO is a browser extension that renders inside the Zscaler admin console. There is no second interface to log into, no data to migrate and no copy of your configuration to keep in sync, because what you are looking at is the Zscaler page itself with additional information drawn on top of it.
Can I turn the enhancements off?
Yes, per table. Every enhanced policy table carries a ZHERO Enhancements switch above it. Turn it off and the table renders exactly as Zscaler renders it, which is what you want when you are comparing against a screenshot or a colleague's screen. The state is remembered for that table.
What does the number next to an entity mean?
It is a usage counter: how many policies use that entity. It reads from local data, so it appears immediately rather than after an API call. The policy lists behind it distinguish how the entity is used: named directly in the criteria, included through a group, or covered indirectly by an Any criterion.
Does my Zscaler configuration leave my device?
No. ZHERO reads your configuration through your own authenticated session and processes it locally in the browser. Configuration snapshots are never stored server-side.