The work you'll never do: the mental list every Zscaler admin carries
Every Zscaler admin carries a mental list of cleanup work too tedious to ever do by hand. ZHERO turns it from impossible into a spreadsheet round-trip.
Every Zscaler admin carries a mental list: the cleanup work you know you should do but never will, because doing it by hand would take days. Which of your 290 locations still carry traffic. Which URLs in your config are dead. What is really flowing through a discovery wildcard. ZHERO turns that list from impossible into a spreadsheet round-trip, by letting your configuration data finally leave the console.
The mental list every Zscaler admin carries#
Not the official backlog. The mental one. The things you know matter and never get to, because the effort is absurd relative to a normal week. After years of assessments on production tenants, the same three items show up on almost everyone’s list:
- Check which of your locations still generate traffic, and which are just configuration nobody has touched in years.
- Cross-reference every URL in your ZIA configuration (policies, firewall, DNS, app profiles, PAC files) to find the dead entries.
- Take a ZPA discovery wildcard and work out which domains and ports your users actually hit, so you can tighten it.
You know this work matters. You also know it would take days. So it stays on the mental list, quietly accumulating risk.
Why the work never gets done#
Two reasons, and neither is about competence.
The first is arithmetic. Verifying 290 locations by hand means opening each one and cross-referencing it with traffic logs, 290 times. Nobody does that. The native console shows you the data, but getting an answer out of that data is a different job: multiple searches, manual cross-referencing, copy-pasting into spreadsheets. Most admins, quite reasonably, do the minimum.
The second is format. On one engagement the networking team that owned the locations was external, and the two groups had no shared format to collaborate on. The value was not just in knowing the numbers, it was in making them portable. When information leaves the Zscaler console in a form that non-Zscaler people can work with, workflows that were never possible suddenly are.
What changes when the data leaves the console#
ZHERO started with two exports. Today it is fifteen, but the number is not the story. The story is what happens when your configuration data is finally in a format you can filter, annotate and hand off. Every export runs through one unified Export Engine, so the same controls apply everywhere:
- Column selection and drag-and-drop reordering, so the sheet says what you need it to.
- Matrix mode, which expands multi-value fields into one column per value.
- Export templates, so you save a column layout once and reload it in a click next time.
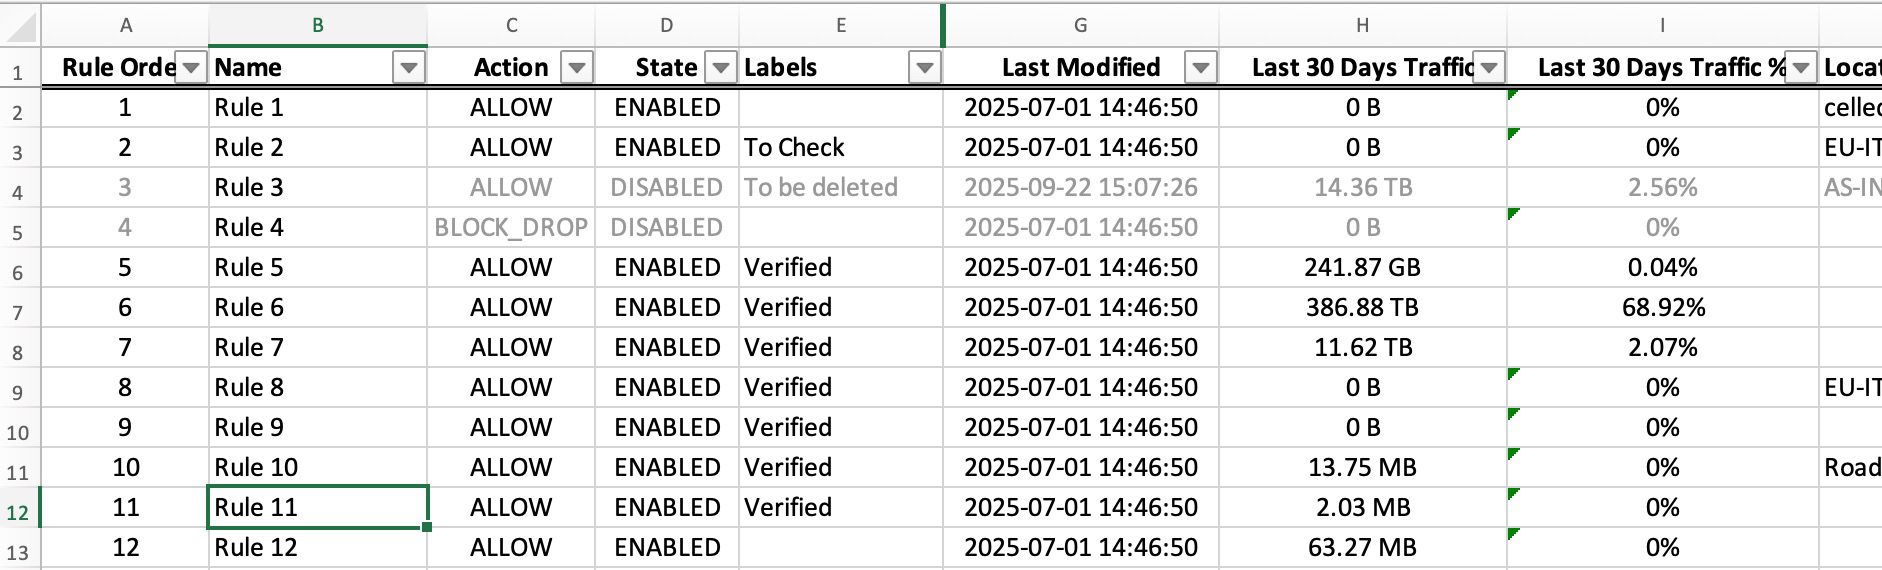
- Traffic data on Locations and Firewall Rules: the real volume over the last 30 or 180 days, right next to each entry. Instantly see what is active and what is a ghost.
Every document arrives formatted, with headers, filters, freeze panes and conditional highlighting already in place. No post-processing. And it all happens locally, in your browser, through your existing admin session: your configuration never leaves your machine.
Case one: 290 locations, and 180 were ghosts#
A customer had 290 locations configured in ZIA. Nobody could say which were still live. We exported all 290 to Excel with one extra column: traffic volume. The result was blunt.
180 of 290 locations at zero traffic. Sixty-two percent of the estate was obsolete or misconfigured, inflating the attack surface for no operational reason.
The spreadsheet went to the external networking team. Filter, annotate, flag for removal, hand it back. A cleanup workflow that had been effectively impossible became a spreadsheet round-trip. That is not a feature. That is a capability shift.
Case two: the wildcard nobody could see inside#
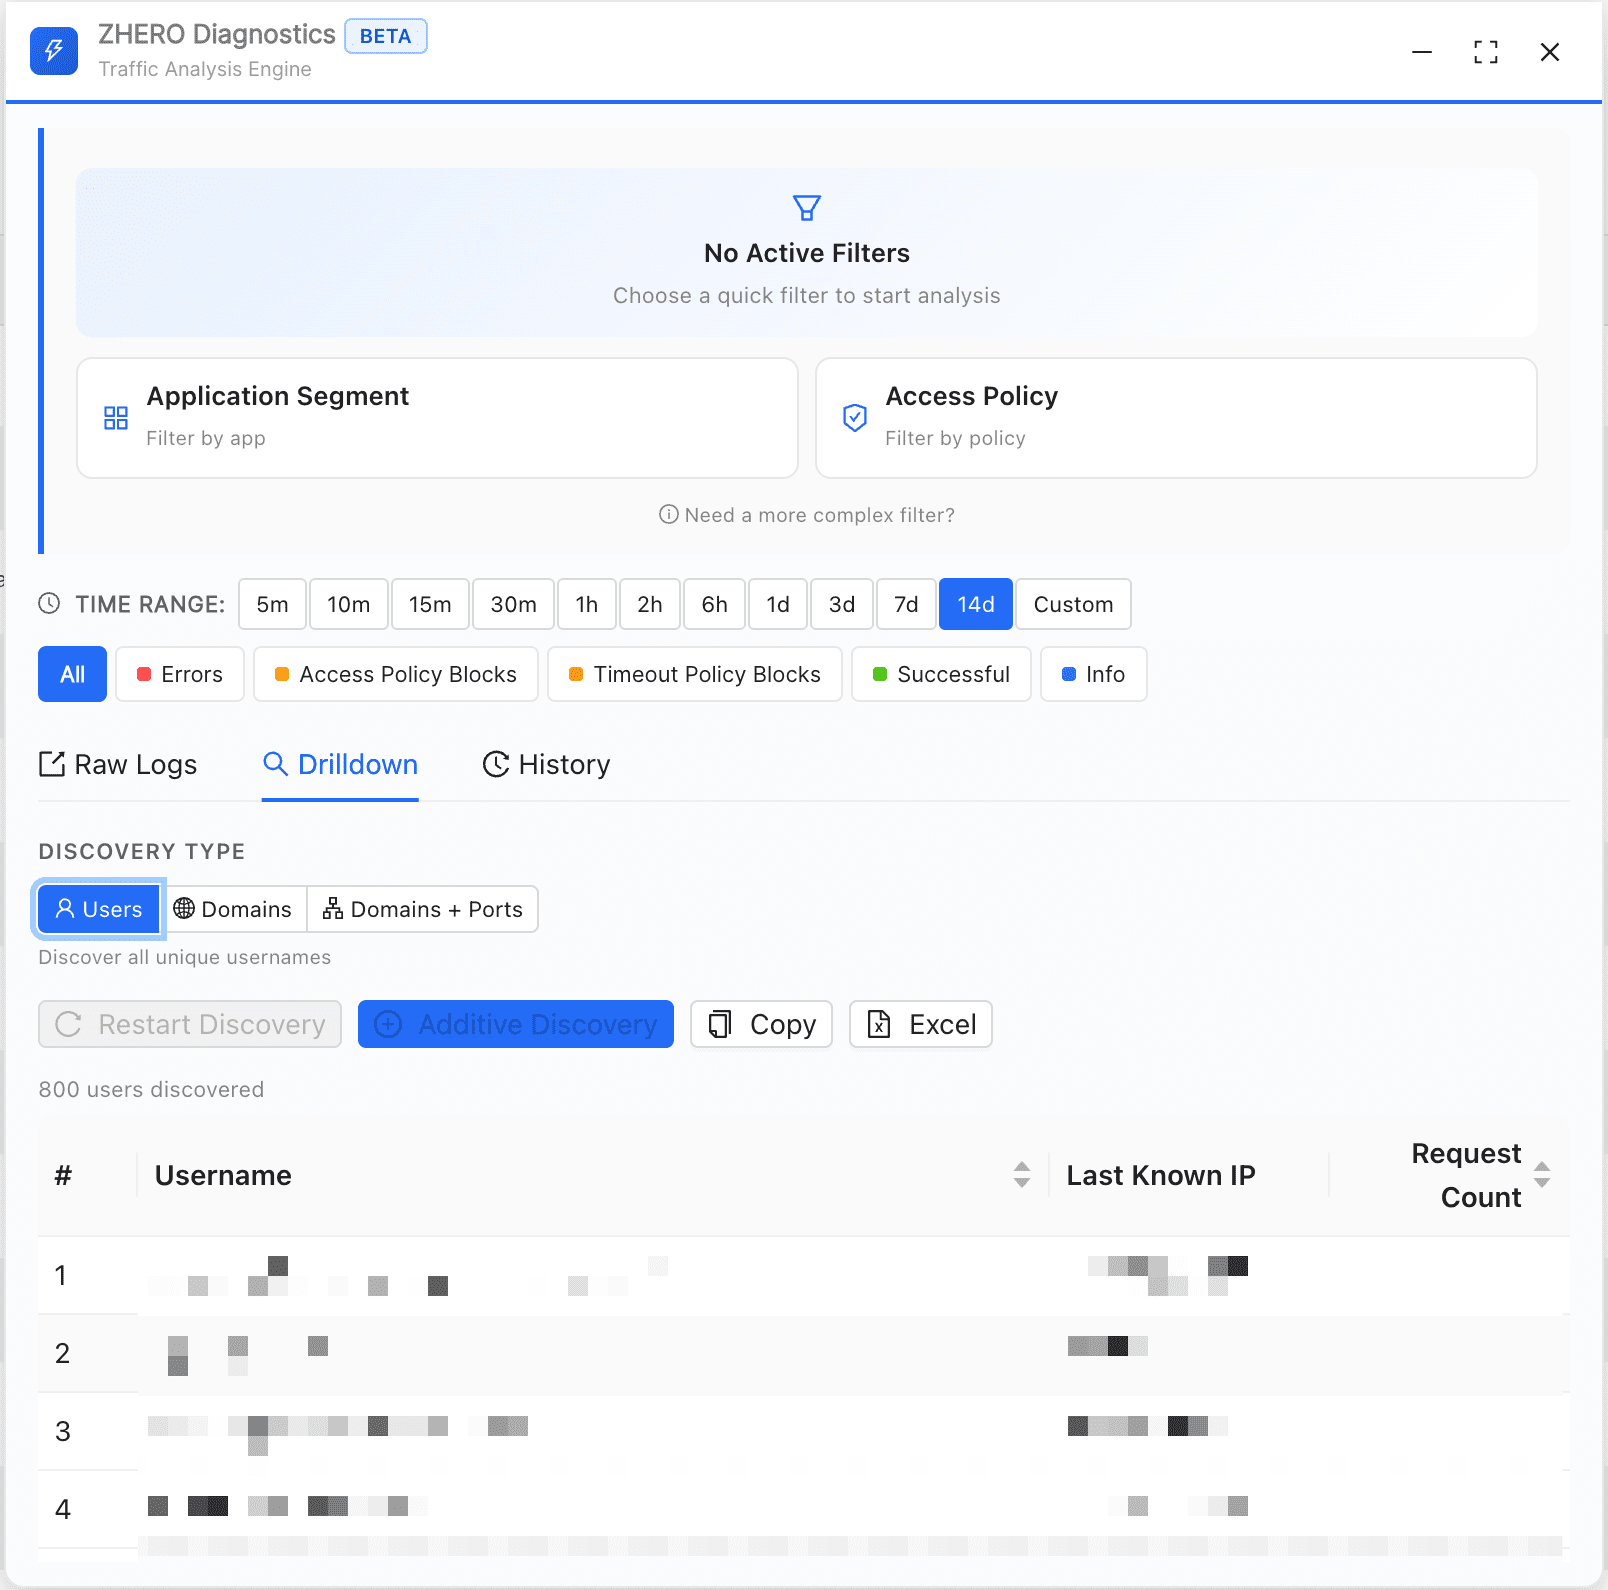
The third item on the mental list is the hardest, because a ZPA discovery wildcard is a black box by design: hundreds of domains flowing through, nobody sure what is legitimate and what is noise, and only 14 days of logs to reason about. On one engagement we opened the ZPA Diagnostics panel, ran a search on the wildcard segment, and drilled down by domain and port. In seconds we had the complete list of every combination users were actually hitting.
The customer’s reaction was the whole point: “We’ve been trying to get this data for months.” They used it to split the wildcard into targeted segments and shrink the attack surface. Work that would have taken days of manual log analysis, done in minutes. I wrote up that story on its own, because it deserves the detail: how to open a ZPA discovery wildcard. The engine behind it lives on Investigation and Diagnostics, and it is currently in beta.
The ROI is not a percentage#
Here is where the math is different from the usual efficiency pitch. When you speed up a daily task, the return is hours saved, and you can put a percentage on it. When you enable work that would otherwise never happen, the return is the risk that was silently accumulating: dead locations inflating your attack surface, discovery wildcards staying broad for years, dead URLs nobody audits.
That is not a 75 percent time reduction. That is going from zero to done. The item leaves the mental list, and the risk behind it leaves with it. If you want to see your own list turned into spreadsheets you can act on, bring your tenant to a demo and we will run a few of these exports together, live.
Frequently asked questions
How many exports does ZHERO offer for Zscaler?
Fifteen, all produced by one unified engine: seven for ZIA (URL inventory, firewall rules, locations, profiles and PAC, SSL inspection, URL filtering, cloud app control), five for ZPA (access policies, application segments, diagnostics logs, user and domain drilldowns) and three for collaboration and audit. Each arrives formatted, with headers, filters and freeze panes already in place.
Can I add real traffic data to a Zscaler export?
Yes. On Locations and Firewall Rules you can attach the actual traffic volume over the last 30 or 180 days, next to each entry. That single extra column is what separates a config dump from a decision: you instantly see what is active and what is a ghost, without opening anything one by one.
Does ZHERO send my Zscaler configuration to its servers?
No. Every export is generated locally in your browser, through your existing Zscaler admin session. Your configuration and your traffic data never leave your machine. The only thing ZHERO receives is licensing data. Getting your data out of the console does not mean handing it to someone else's cloud.
What is the ZPA Diagnostics Engine?
A panel, currently in beta, that runs alongside the native ZPA Diagnostics page. From any search you can drill down by users, by domains, or by the full domain and port combination, then export the result to Excel in one click. It is how you finally see what is flowing through a discovery wildcard.