Can this user reach it? From a vague Zscaler ticket to the cause
A Zscaler ticket with only a day on it, worked end to end in ZHERO: what the configuration says, what the logs saw, and the moment it broke.
“Claude stopped working for me on Wednesday.” That is the whole ticket. No time, no error message, no screenshot, just a day. Every Zscaler team knows this ticket, and knows how the afternoon goes: check the user’s forwarding, read the policies one type at a time, open the web logs, then the firewall logs, then try to remember which of the ten tabs had the answer.
The ZHERO Troubleshooting Engine is built for exactly this ticket. It works inside the Zscaler console and puts three things in one drawer: what the configuration says should happen, what the logs say did happen, and the moment it broke. Here is the same ticket, worked end to end.
Start from the ticket, not from the console#
You describe the ticket once: the user as the source, the destinations as the target. ZHERO turns every combination into a scenario (who, from where, to what), up to twelve at a time, and lines them up in a rail. That is useful beyond this ticket: add the other destinations from today’s queue and each gets its own answer, in the same drawer.
Before any policy applies, the traffic has to go somewhere. The Forwarding tab, filtered on the user’s devices, shows the path that applies to them: their Mac, the forwarding profile, and the way out, to Internet Access, Private Access or direct. A misassigned forwarding profile shows up here as a path going somewhere you did not expect, before you read a single rule.
The verdict: what the configuration says#
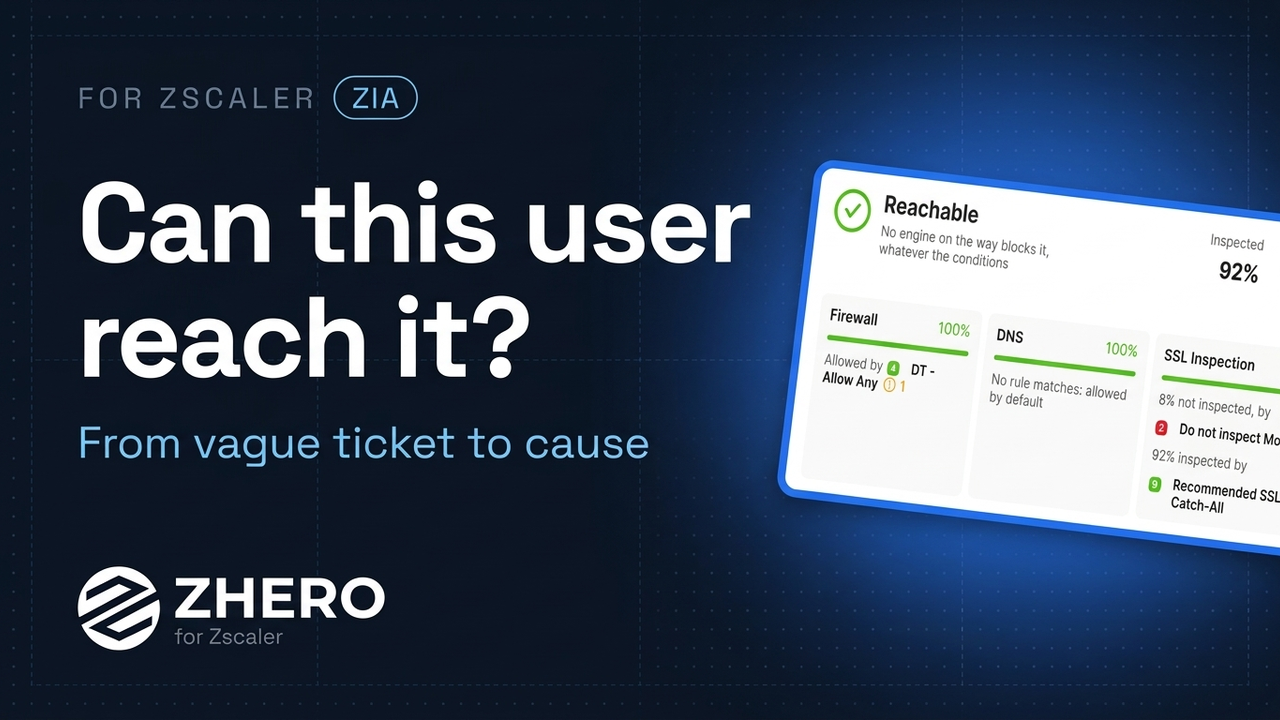
On the Policies tab the answer comes first. For this user and this destination: Reachable.
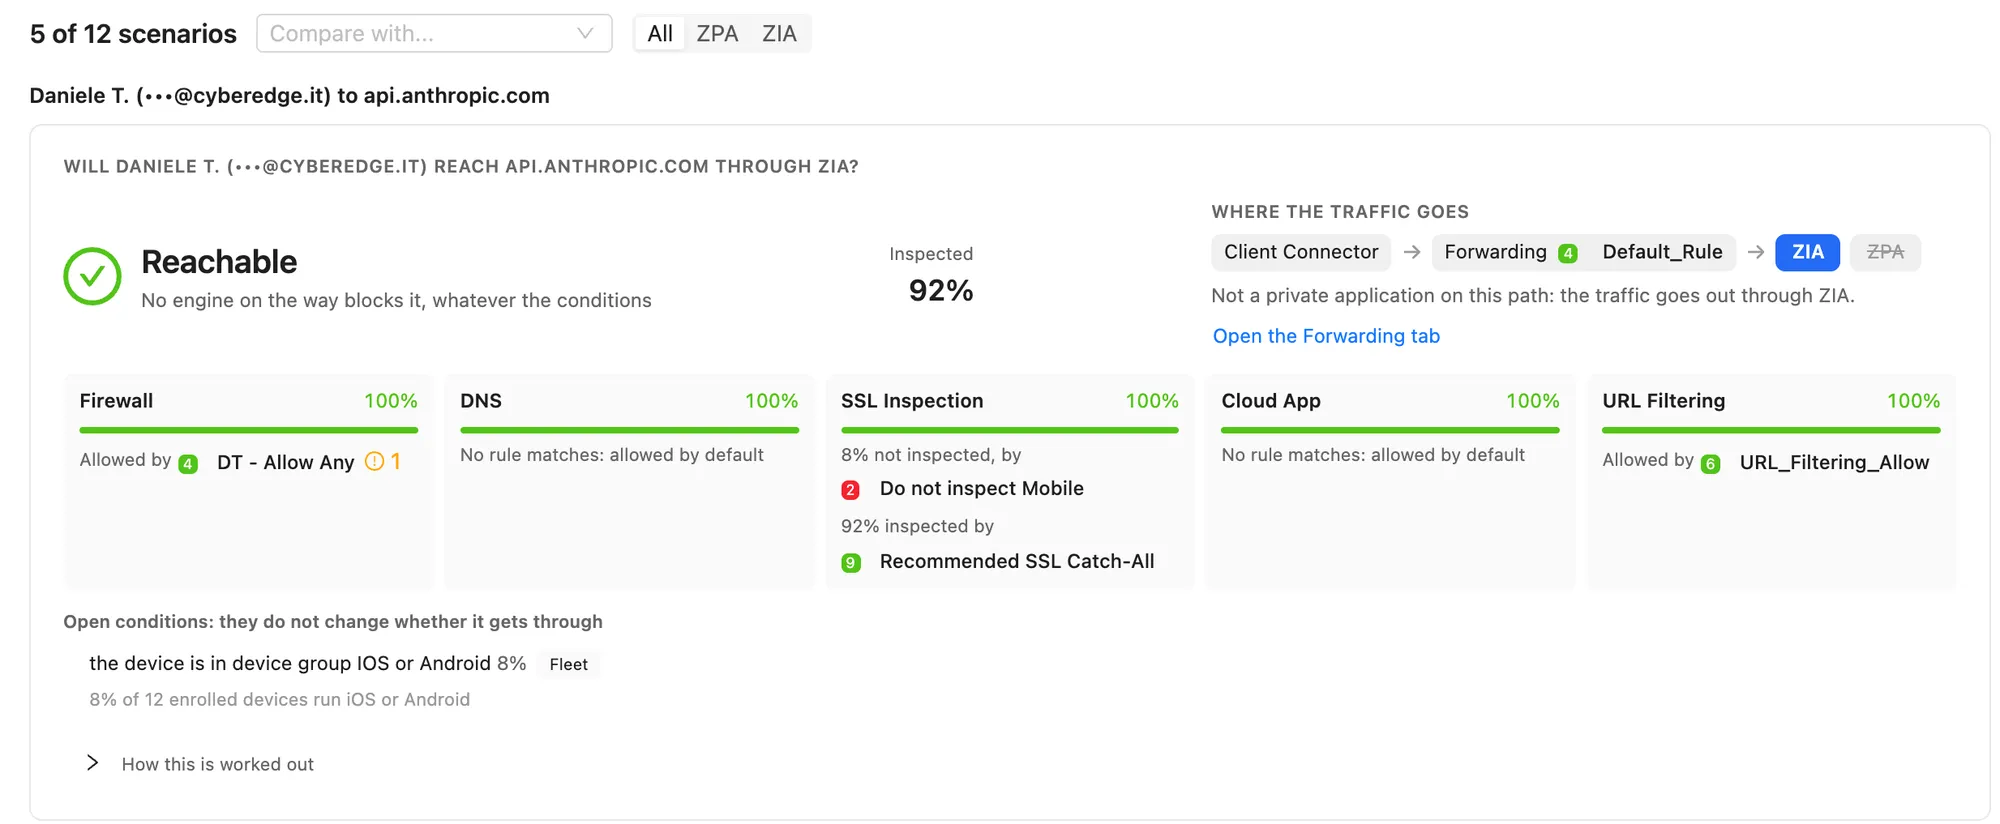
The verdict is not a guess. ZHERO walks the traffic through every engine in the order Zscaler evaluates it, and every rule in its real order, first match wins: Firewall, DNS, SSL Inspection, Cloud App Control, URL Filtering. Each tile says what happened there in plain words: allowed by a named rule, allowed by default, skipped, or never reached. Rules that match but are switched off are listed on their own, not silently dropped, because the rule everybody assumed was doing the work is often the answer.
One figure on this screen matters later: 92% of this traffic is inspected. SSL inspection does not change whether the user gets through, so it does not turn the verdict into an estimate. It does change what can go wrong on the way.
When the answer genuinely depends on something the configuration cannot settle (a platform, a device group, a location), the verdict says so with a percentage: Probably reachable, It depends, Probably blocked. It also shows the evidence behind the number: the user’s own logs first, then the Client Connector fleet, and a plain “nothing measures it” when there is no data at all.
What the logs saw#
Configuration says what should happen. Insights reads what did: the same user’s web and firewall logs, for Wednesday afternoon. And there are blocks. So the configuration is right and the user is right too, and the answer is in the gap between them.
That gap is where most access tickets live. Some blocks depend on the content of a request, not on who sent it and from where: a data loss prevention match, a file type, a threat, an application that refuses the inspection certificate. No configuration verdict can predict those. The logs can.
A day, drawn: where to look first#
The ticket only gives a day, so the Investigation tab starts with Only the day. ZHERO reads the user’s traffic towards the destination for the whole day in one pass and draws it: 144 cells of ten minutes, more traffic in darker blue, blocks in red.
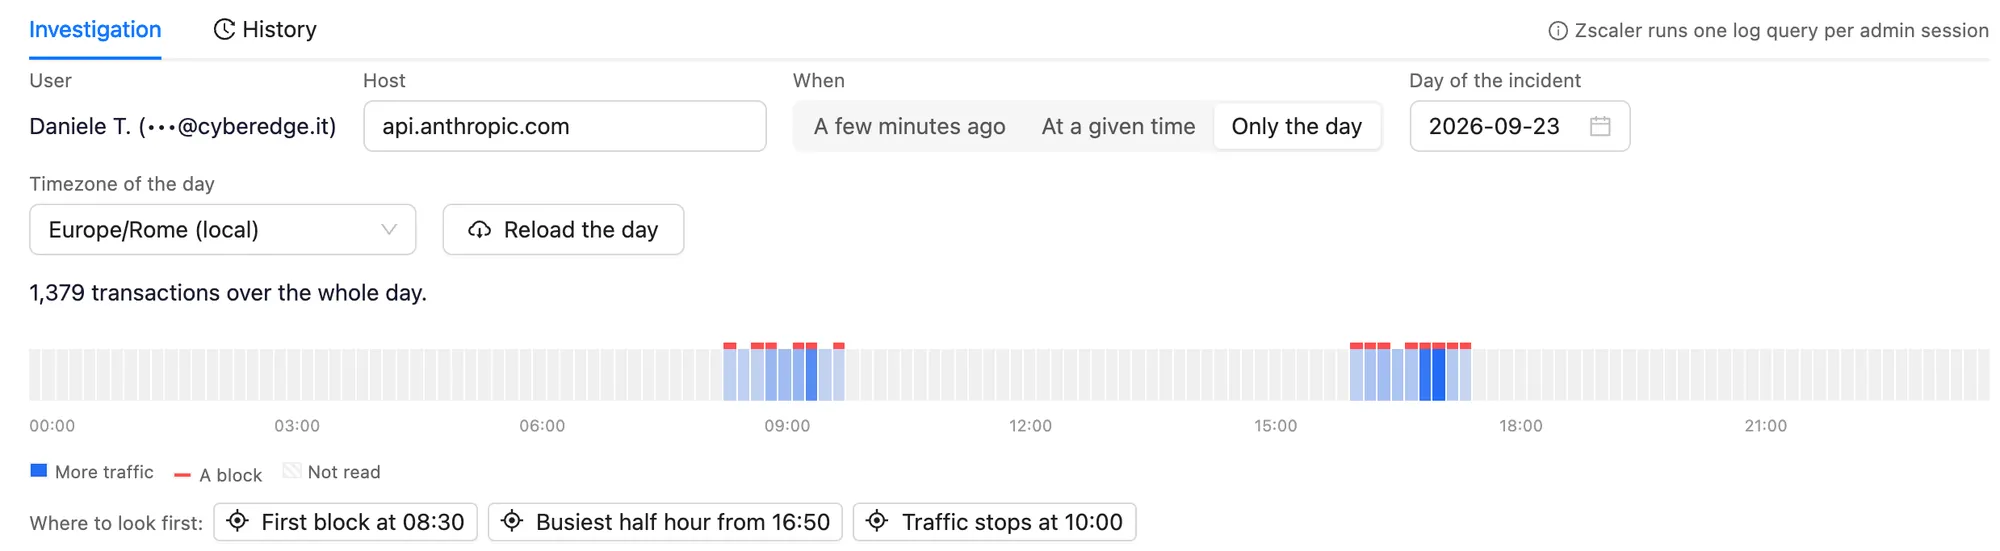
Above the heatmap, Where to look first suggests the moments that usually matter: the first block of the day, the busiest half hour, the moment traffic stops. Here the busiest half hour is just before five in the afternoon. One click selects the window, and Investigate this window prepares the run.
One run, one timeline, the causes named#
Nothing runs until you press Run. Zscaler allows one log query at a time per admin session, so ZHERO does the reads one after another instead of in parallel: the user’s traffic to the host, their ZPA sessions, their other failures, the sub-resources the page loads, the firewall sessions, and whether other users failed on the same target. Six reads become one timeline, and on top of it, diagnosis cards that name the causes.
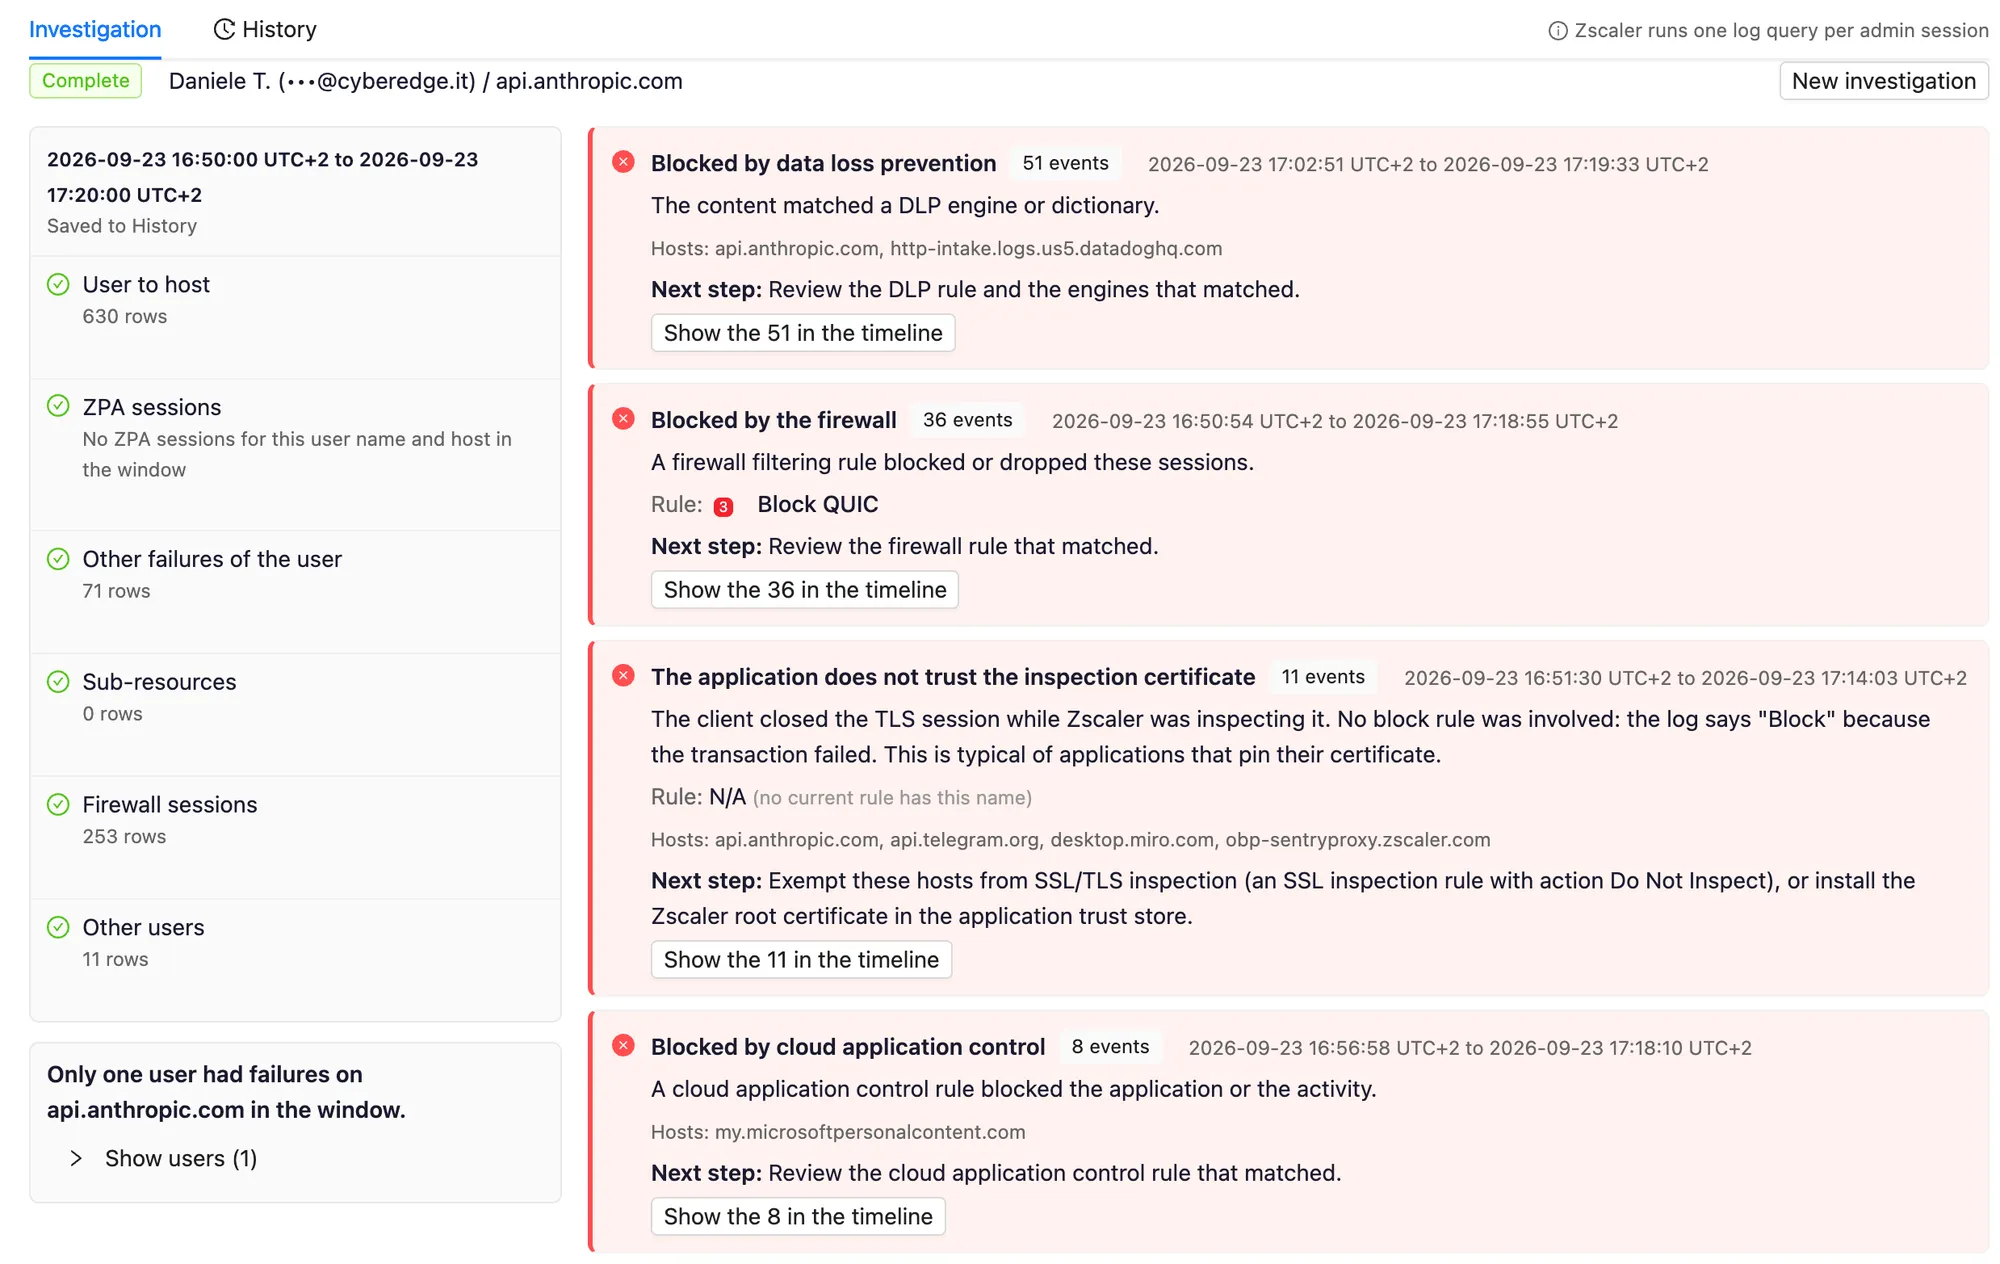
For this ticket, two cards tell the story. Data loss prevention matched the content of some calls. And the application does not trust the inspection certificate: the client closed the TLS session while Zscaler was inspecting it. That is the 92% from the verdict, coming back as the cause. Each card ends with the next step (review the DLP rule, exempt the host from inspection or install the root certificate in the application trust store), and Show these events in the timeline jumps to the evidence. The investigation also answers the question every help desk asks first: only this user failed on that host.
The HAR the user sent#
Sometimes the user sends a HAR file. Drop it into the HAR Analysis panel and ZHERO reads it in the browser: the failed calls stand out, errors are explained in plain words, requests handled by Zscaler are marked, and HTTP/3 traffic gets a warning, because QUIC is not inspected by ZIA.
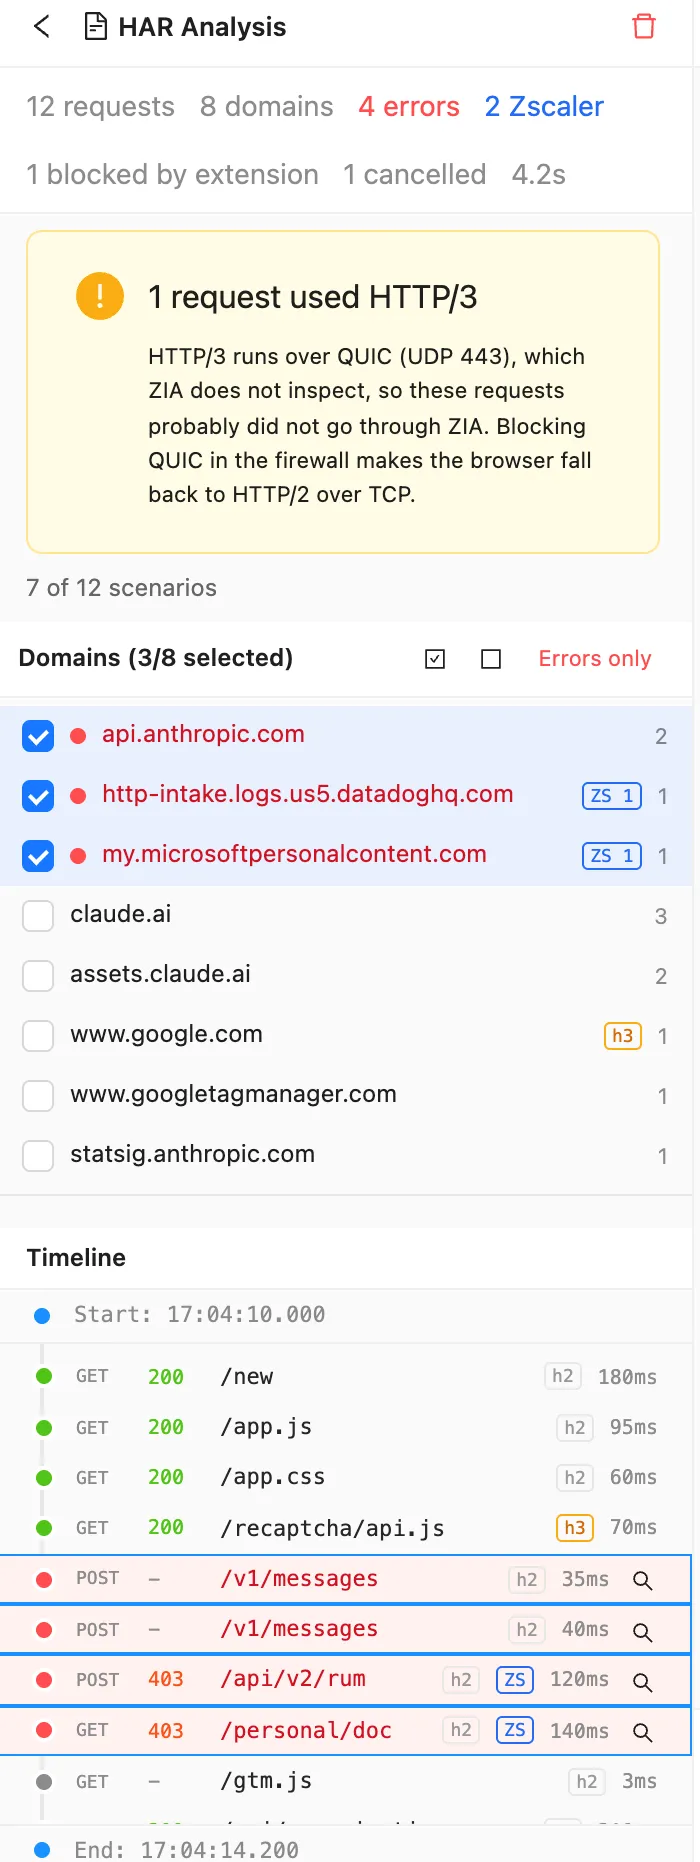
Here the failed calls to the application show a certificate it rejects: the same cause, seen from the other side. Any failed request can be sent to the investigation at that exact second, with the host and the time already filled in.
Name it, pin it, move to the next ticket#
The investigation is saved in History. Give it a name (“Claude on Wednesday, ticket 4821”), pin it, and it is still there for the next engineer or the next ticket. Named sessions are never cleaned up automatically.
The rest of the queue is already in the rail, one answer per scenario: Blocked by URL Filtering, with the rule that decides; It depends, with a percentage and what it depends on; Route depends, when client forwarding does not settle whether the traffic goes to ZIA or ZPA, with both answers side by side; and for a private server, the Private Access sessions of the last two weeks, user by user.
Configuration, logs and the moment it broke#
The hard part of an access ticket was never one lookup. It was holding three views of the same problem at once, across screens that do not talk to each other. The Troubleshooting Engine keeps them in one drawer: the verdict for what should happen, the logs for what did, the investigation for when and why. That is where the 75% reduction in Mean Time To Resolution on the site comes from.
Everything runs in your browser, on top of the console you already use: your configuration never leaves your device, and neither does the HAR. The full walkthrough of each tab is in the manual (Troubleshooting Engine and Log Investigation). The Troubleshooting Engine comes with the full licence: book a demo and we run it on your tenant.
Frequently asked questions
What does the reachability verdict actually evaluate?
For each scenario (who, from where, to what) ZHERO walks the traffic through the engines in the order Zscaler applies them, first match wins: on ZIA Firewall, DNS, SSL Inspection, Cloud App Control and URL Filtering; on ZPA the application segment, Client Forwarding and Access. The answer is Reachable or Blocked by a named engine and rule, or an estimate with a percentage when it depends on a condition the configuration alone cannot settle.
If the configuration says Reachable, why can the user still fail?
Because some blocks depend on the content of the traffic, not on who and where: a DLP match, a file type, a threat, or an application that refuses the inspection certificate. No configuration verdict can predict those. That is why the Troubleshooting Engine puts the logs next to the verdict, and why the log investigation reports these causes as separate diagnosis cards.
What if the ticket has no time on it?
Choose Only the day in the Investigation tab. ZHERO reads the user's traffic towards the target for that whole day, draws it as a heatmap of ten-minute cells with the blocks marked in red, and suggests where to look first: the first block, the busiest half hour, the moment traffic stops.
Does ZHERO run log queries on its own?
No. Zscaler allows one log query at a time per admin session, so ZHERO prepares the reads and waits for you to press Run. Nothing replaces a query you already have running.
Does the HAR file leave my machine?
No. The HAR is analysed in the browser and its query strings are never stored. No configuration or traffic data is sent to ZHERO servers.
Is the Troubleshooting Engine in the free trial?
No. The Troubleshooting Engine and the log investigation are released with the full licence. Book a demo and we run it on your own tenant.